Rainfall maps
Northland rainfall maps are generated from a network of about 40 automatic rain gauges operated principally by Northland Regional Council but also including some operated by MetService and NIWA.
Produced and available on or about the first working day of the following month, the maps are based on how much rain has been recorded at the automatic rain gauge sites as a percentage of what would normally be expected (ie percentage of normal). The ‘percentage of normal’ contours are based on these points.
The data is raw and unaudited and the contours give a ‘general’ indication of the spread of rainfall in the region for the month compared to the long term median.
NRC would like to thank MetService and NIWA for making their automatic rainfall data available for the generation of these maps.
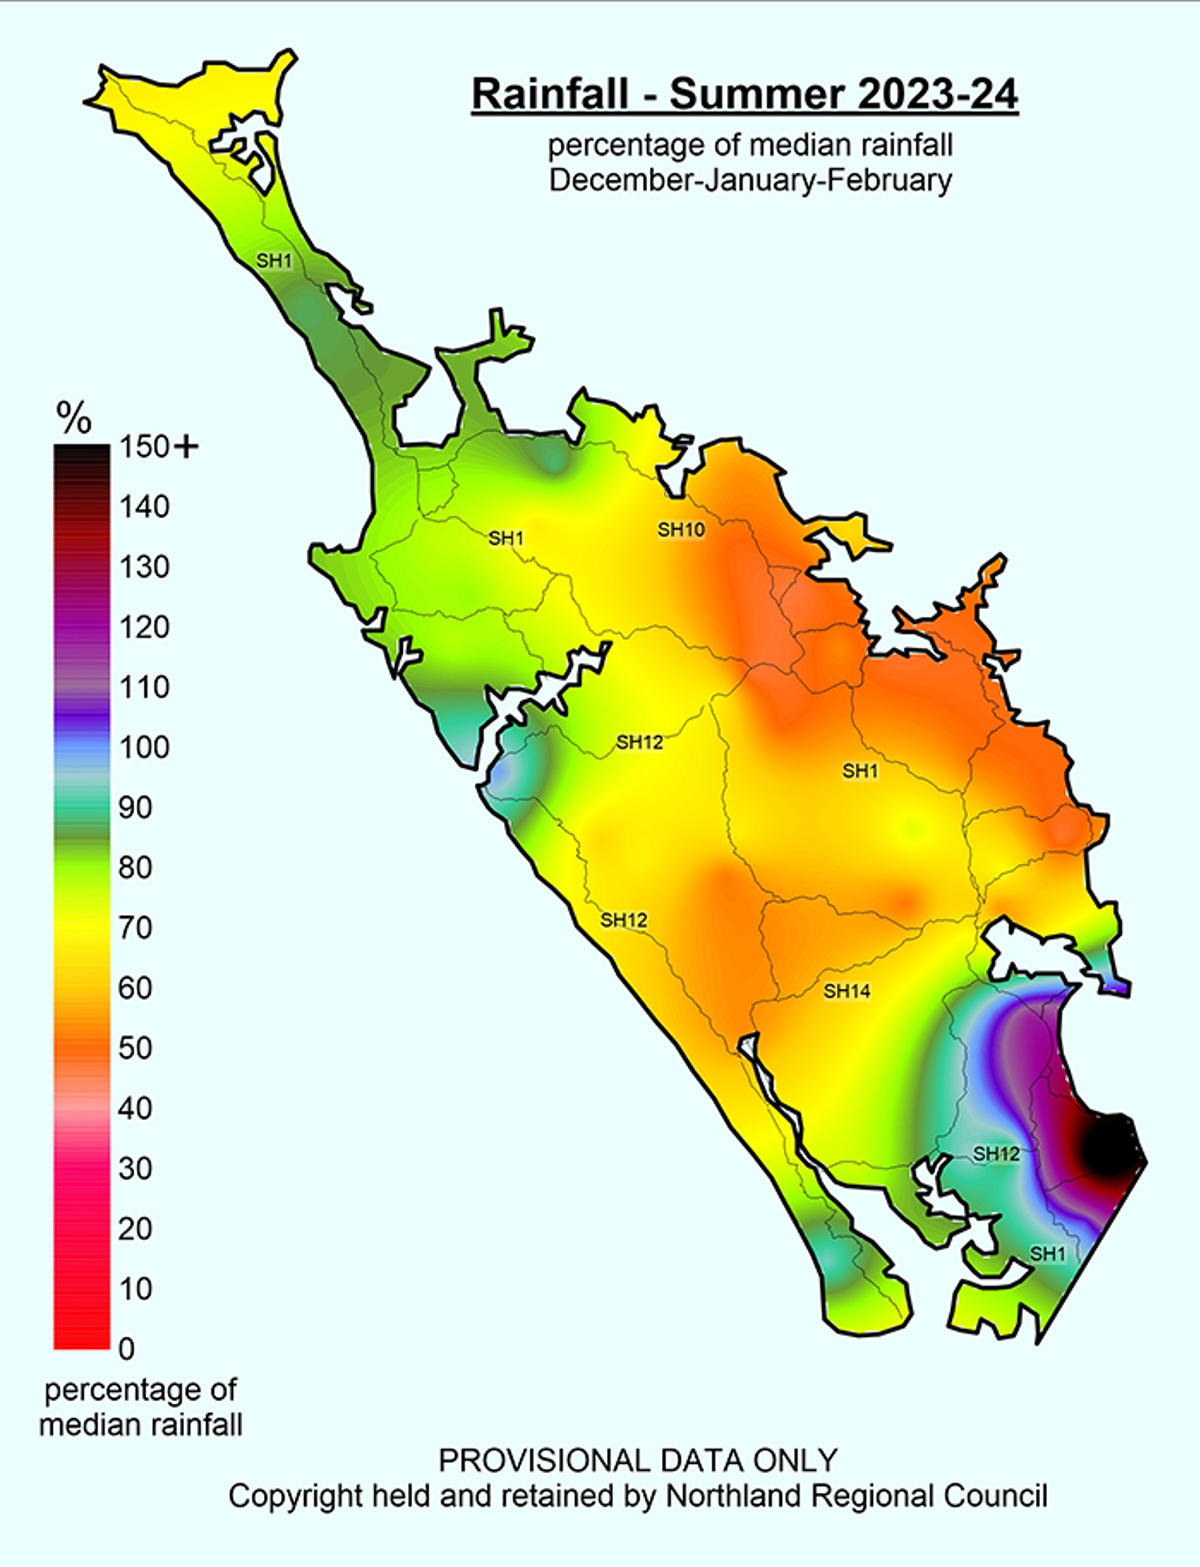
 Summer 2023 24
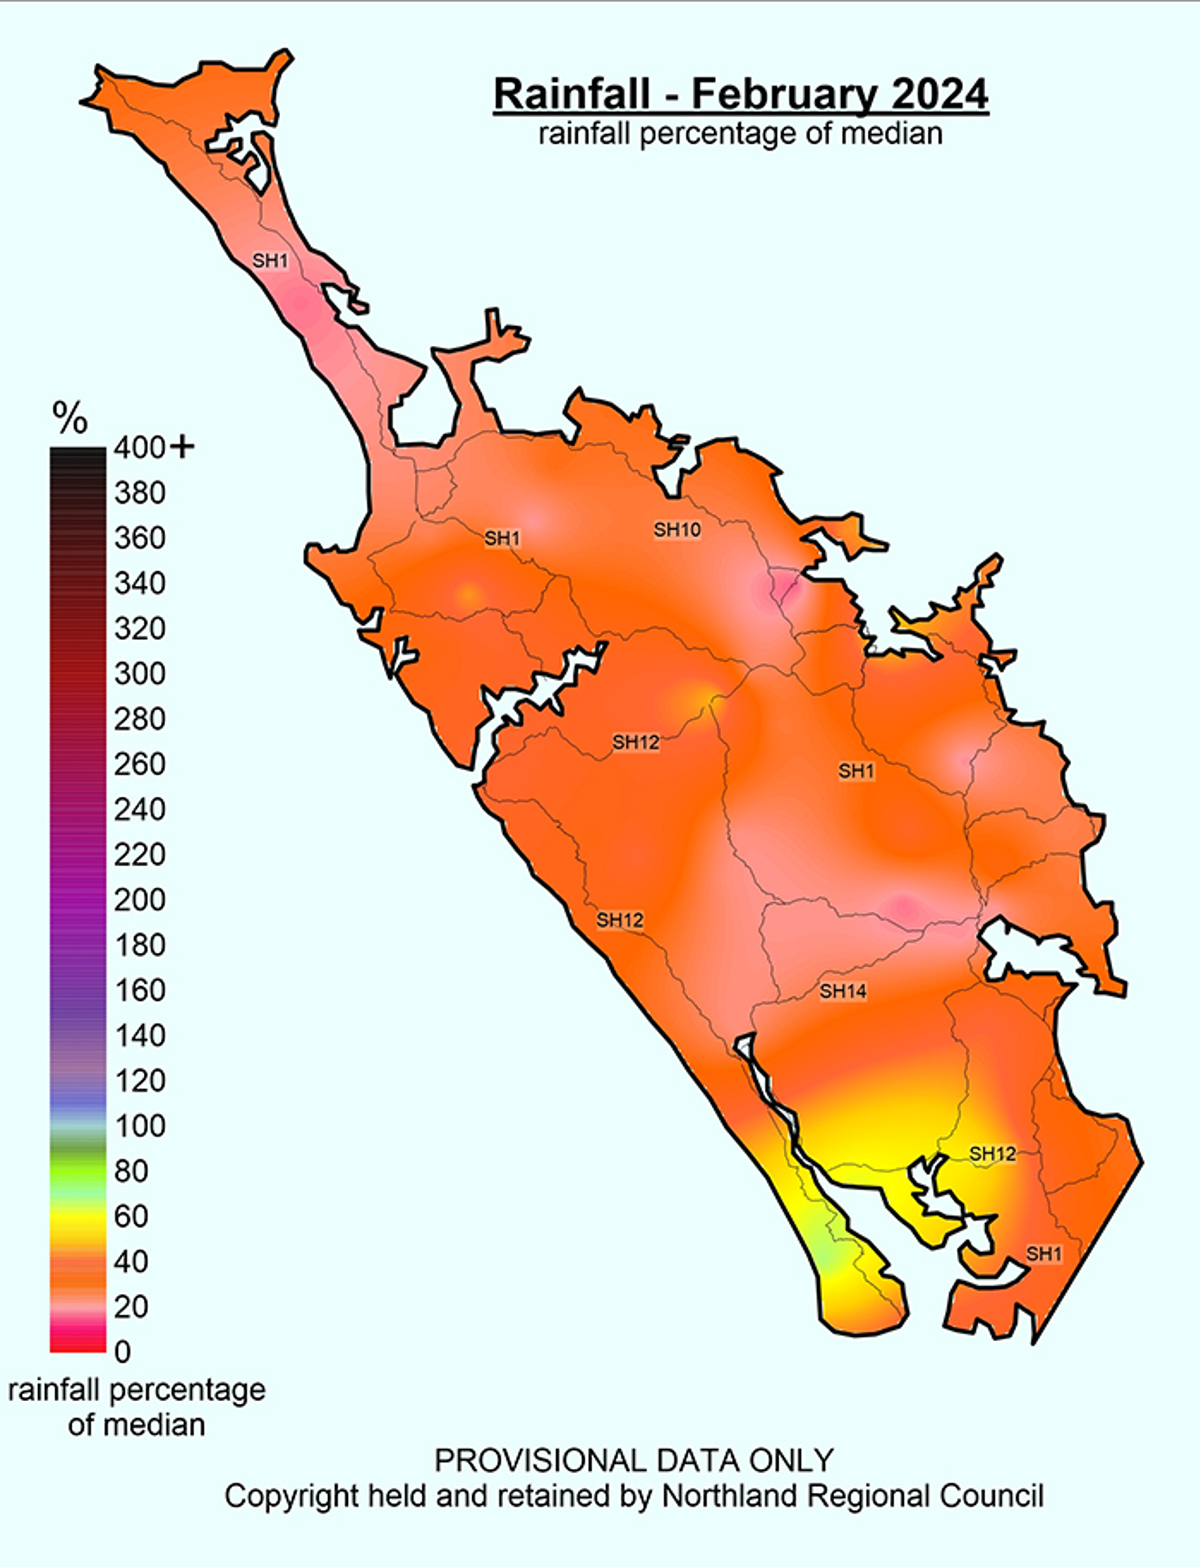
 February 2024 Rainfall Percentage Of Median
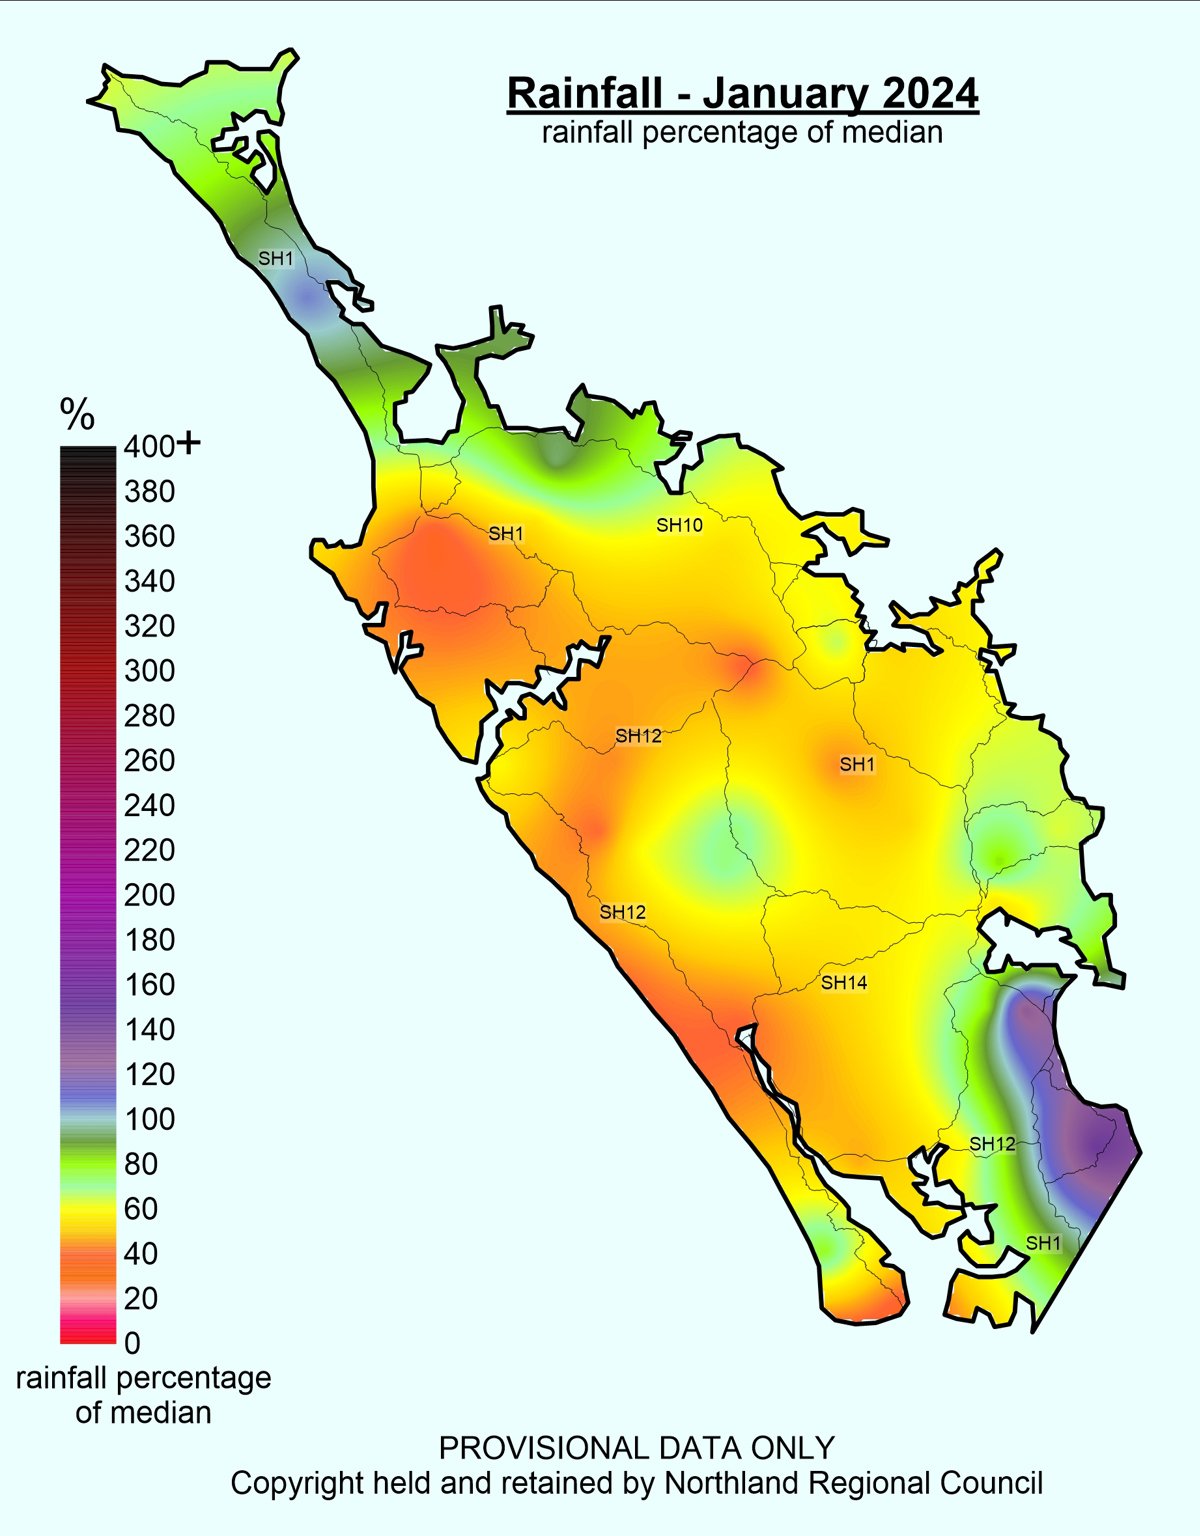
 January 2024 Rainfall Median Percentages
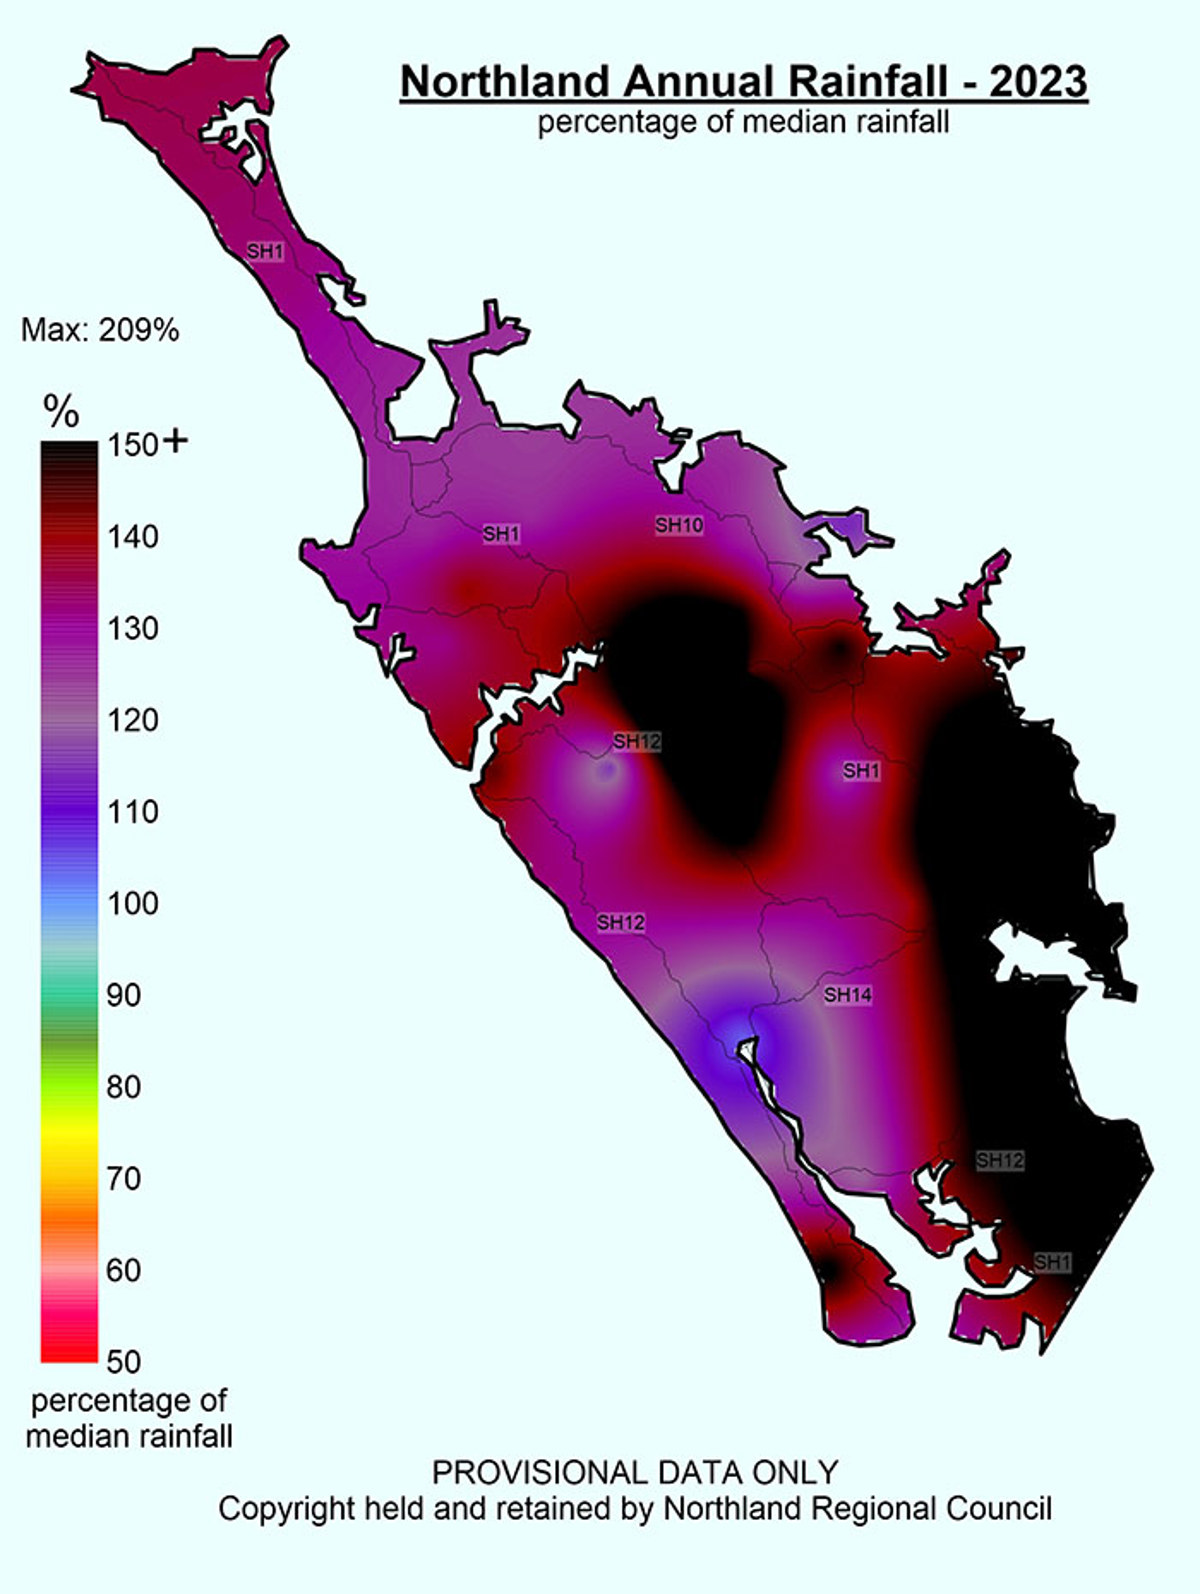
 2023 Annual Rainfall Percentages
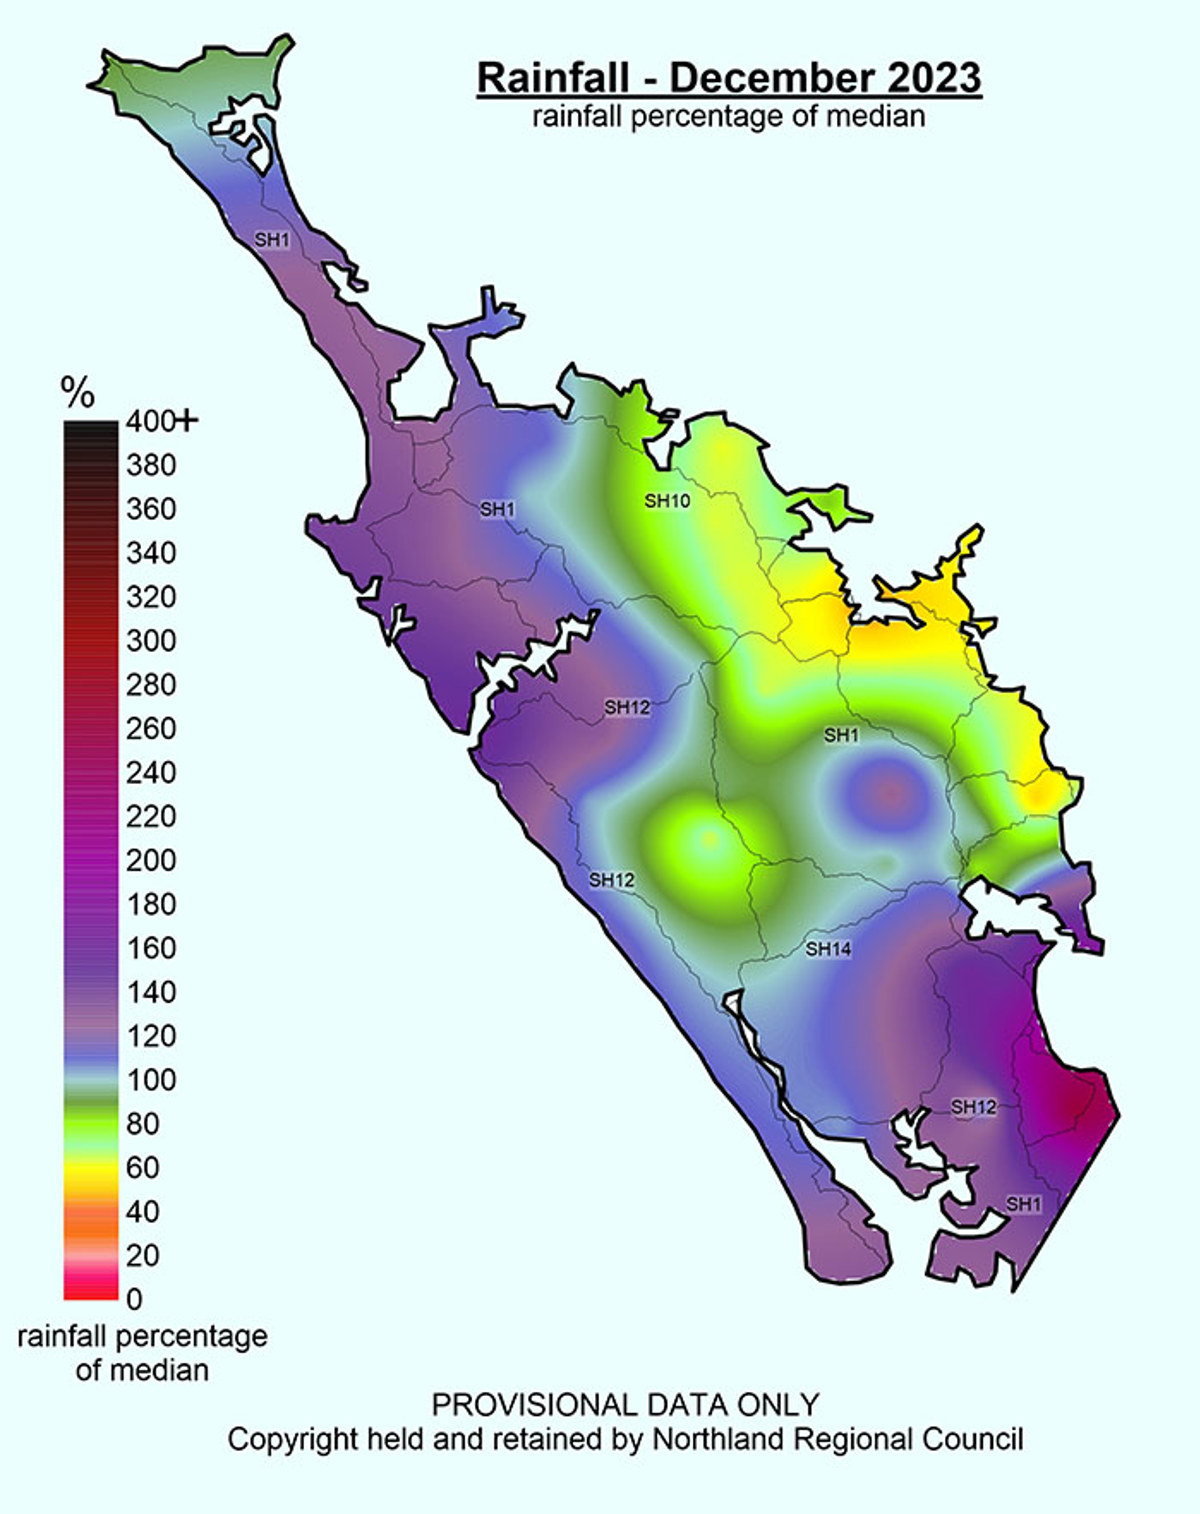
 December 2023 Rainfall Percentages
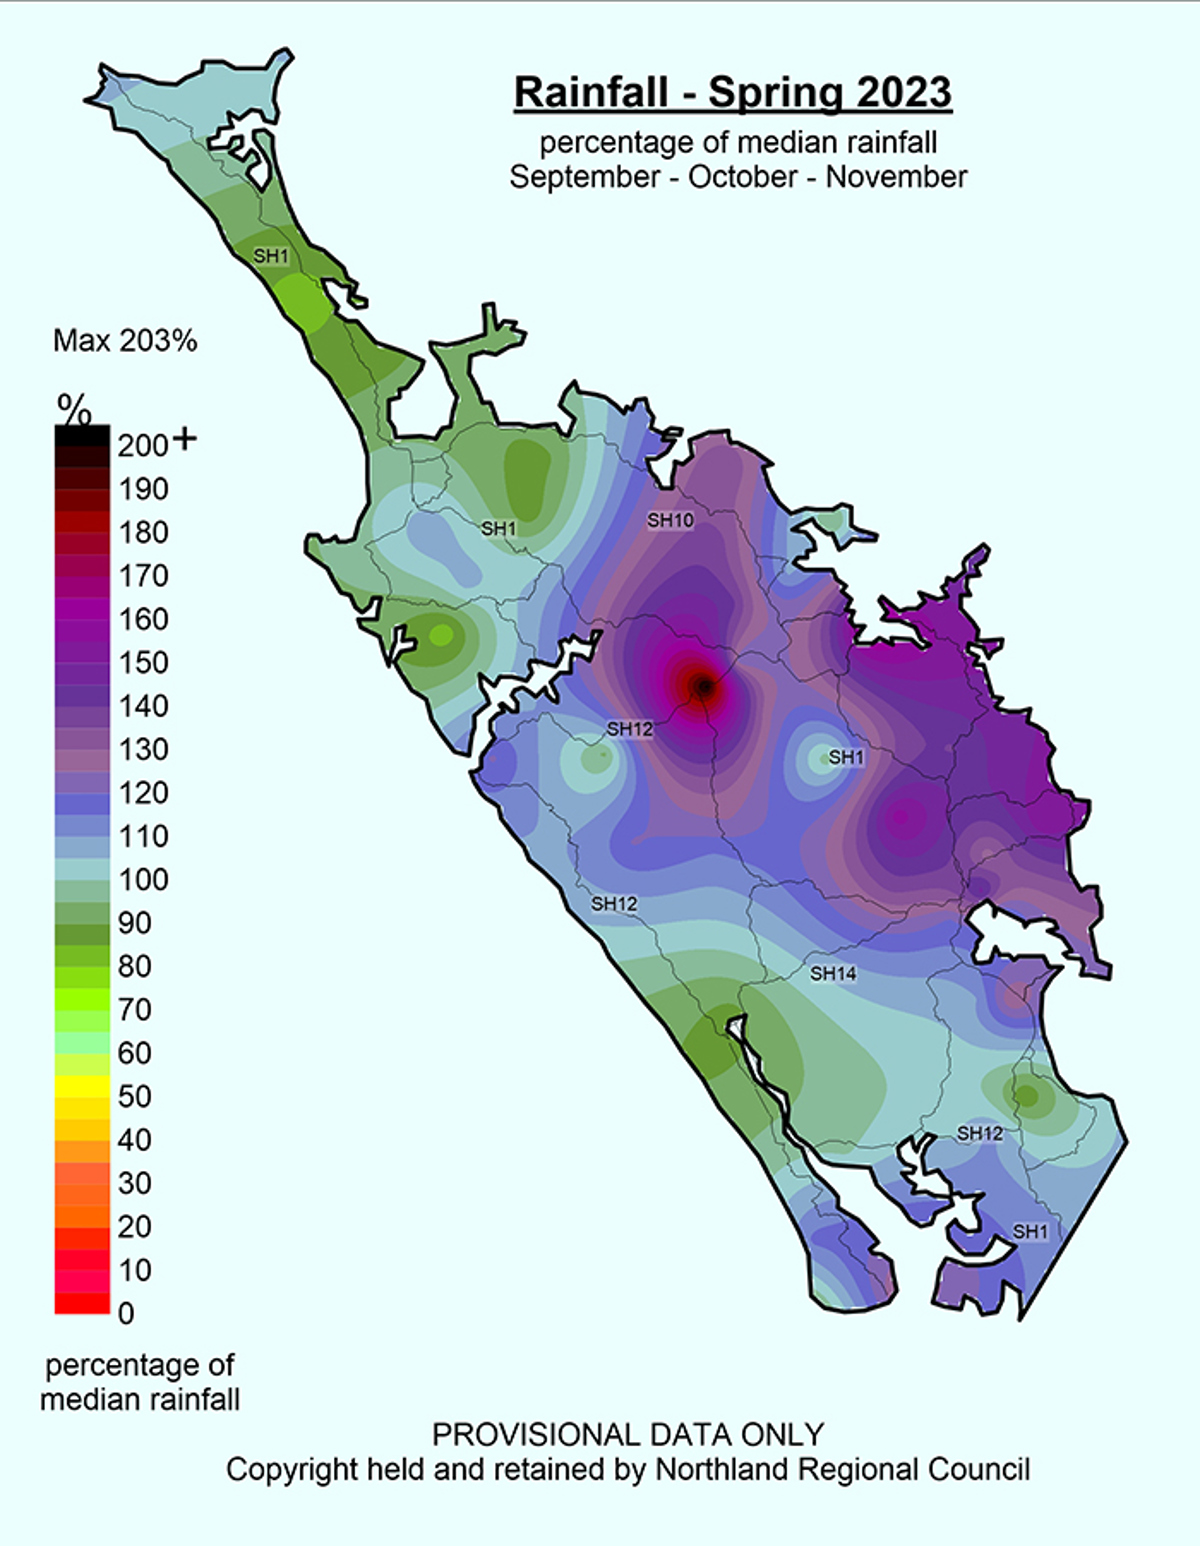
 Spring 2023 Median Rainfall Percentages
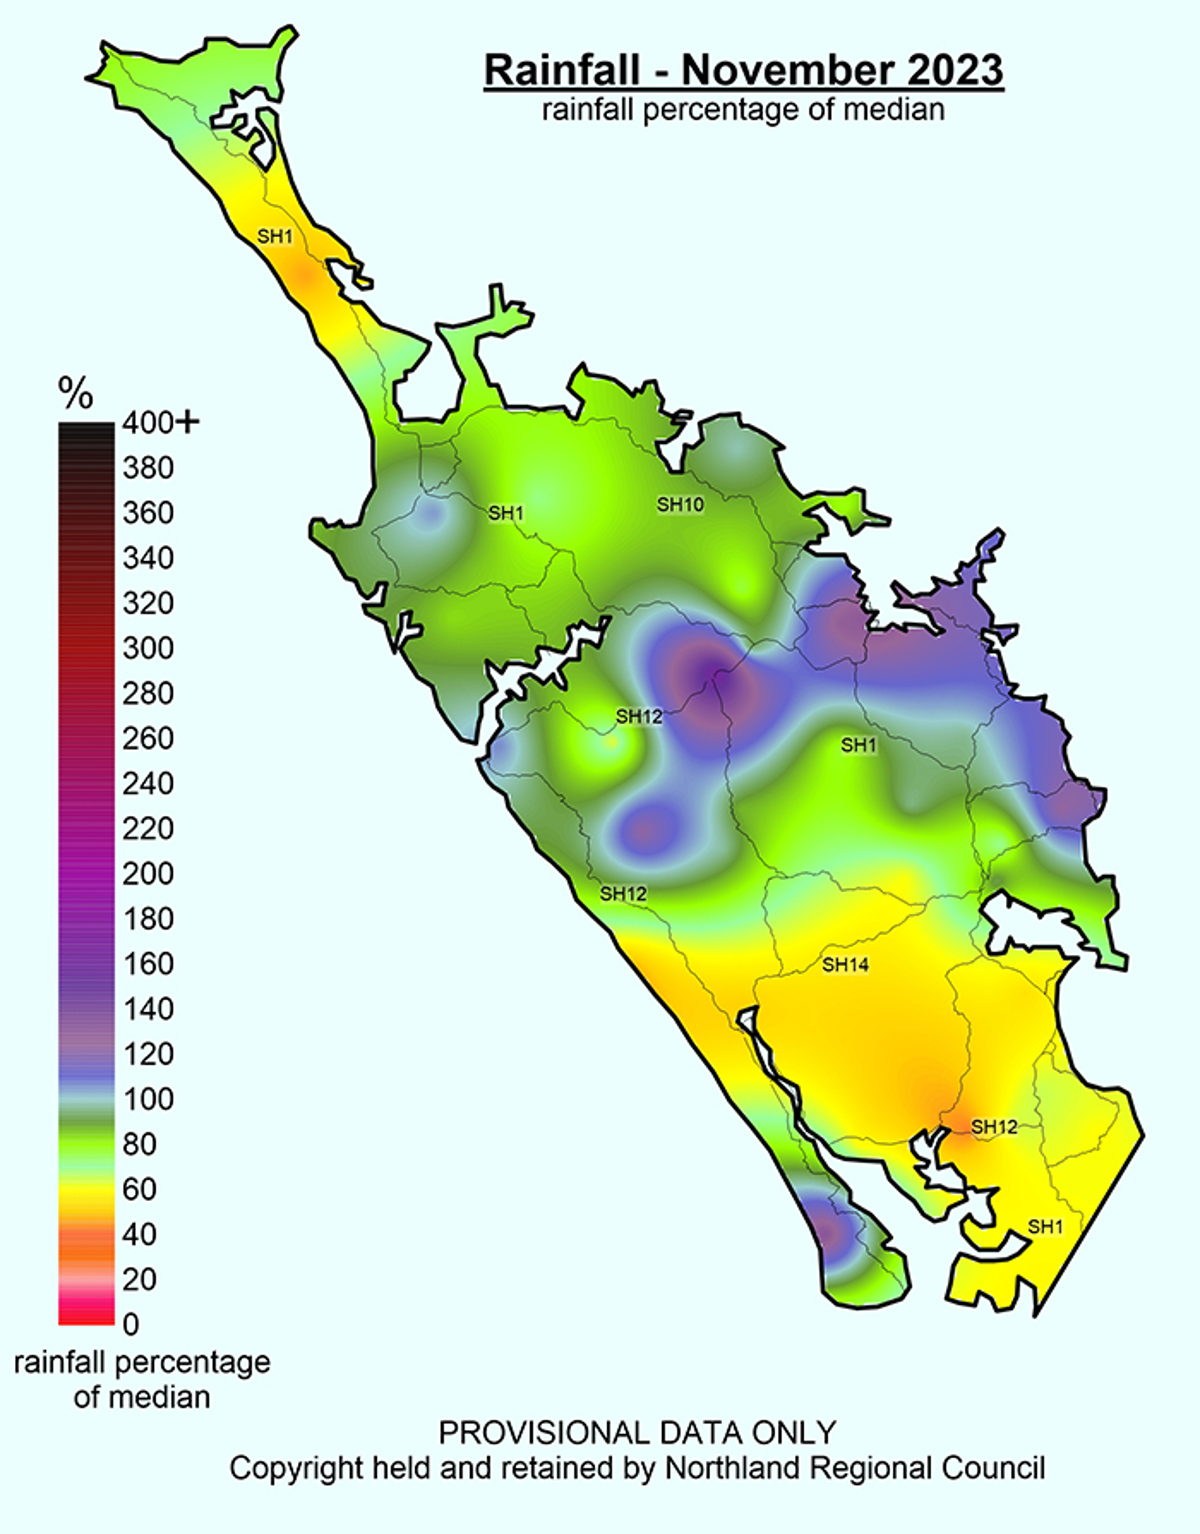
 November 2023 Rainfall Percentages
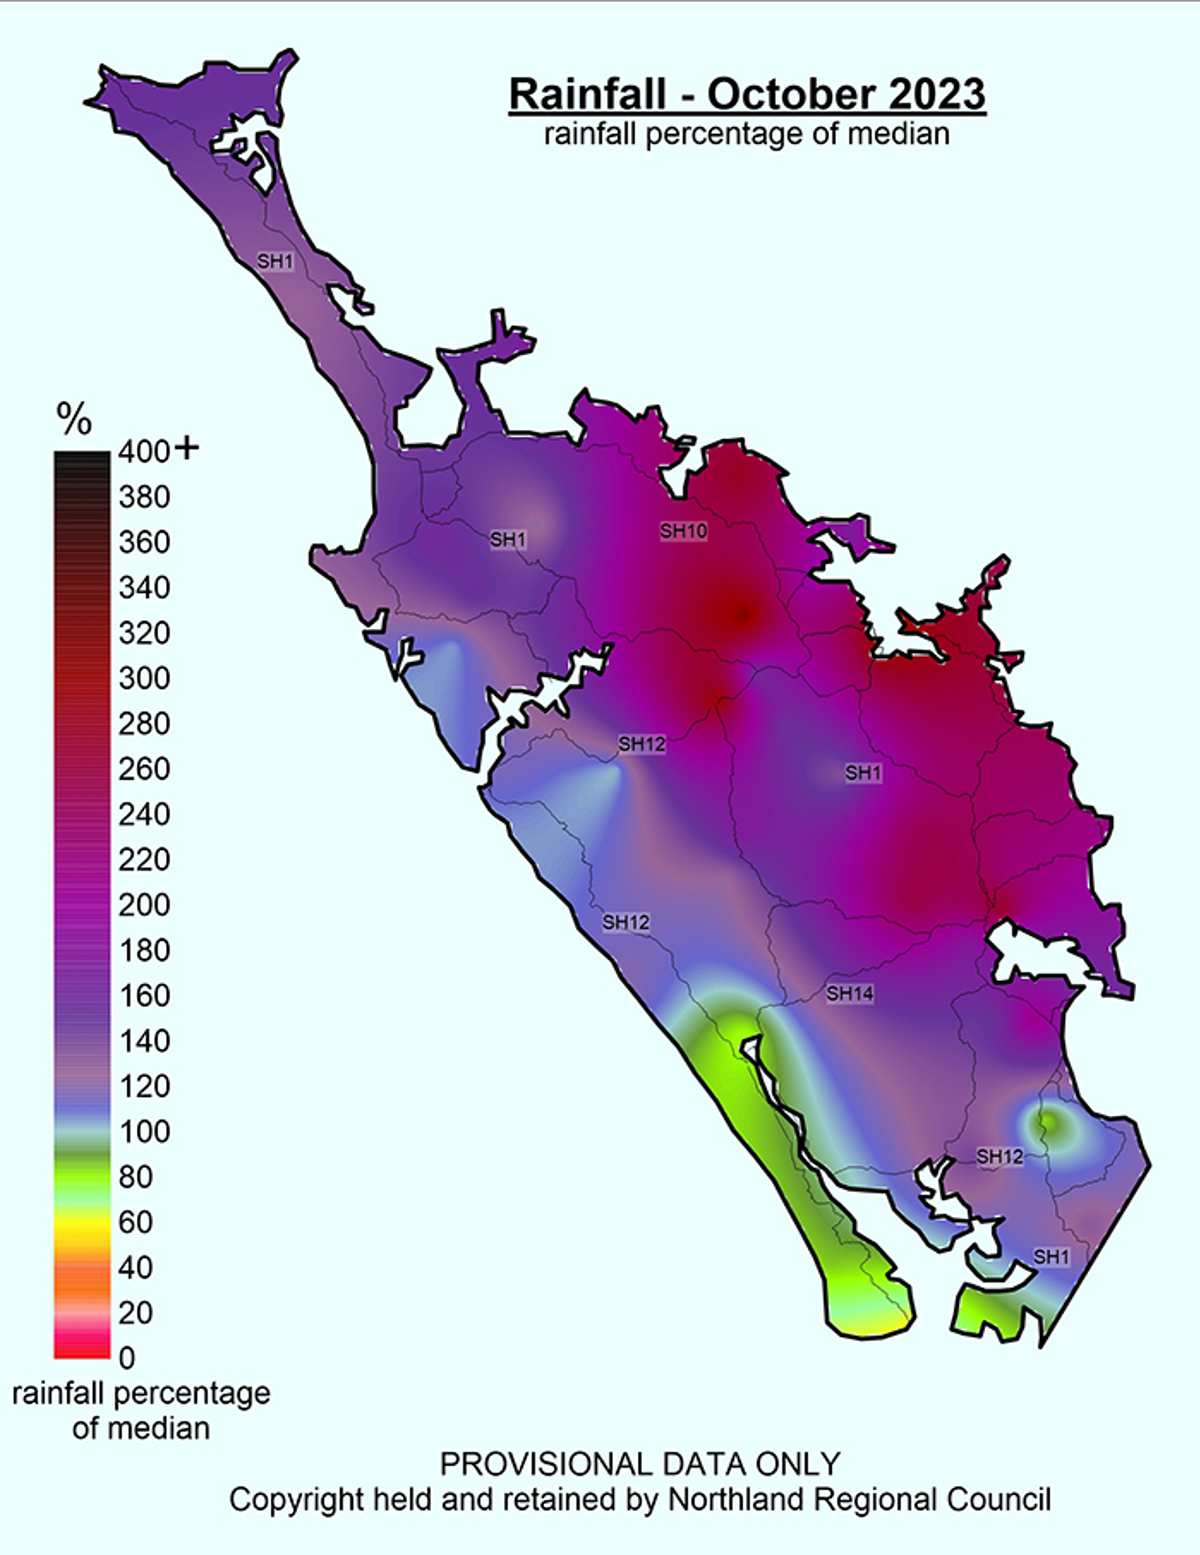
 October 2023 Rainfall Percentage Of Median
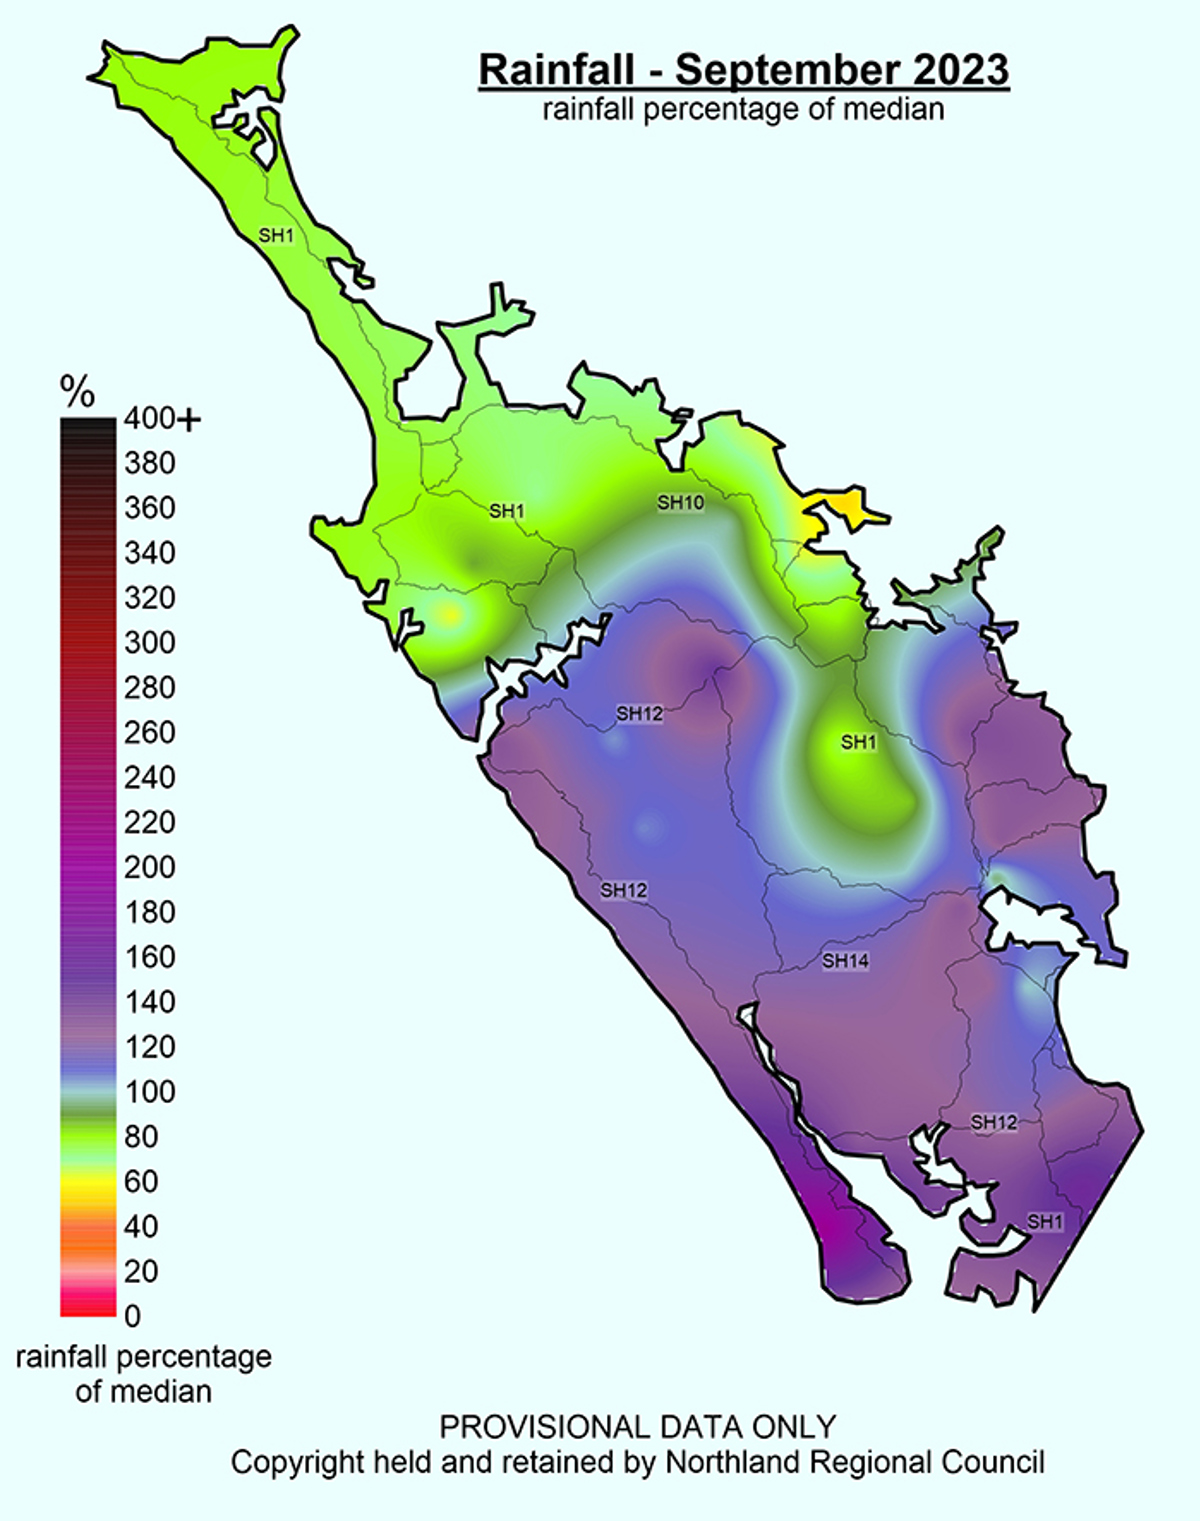
 September 2023 Median Rainfall Percentages
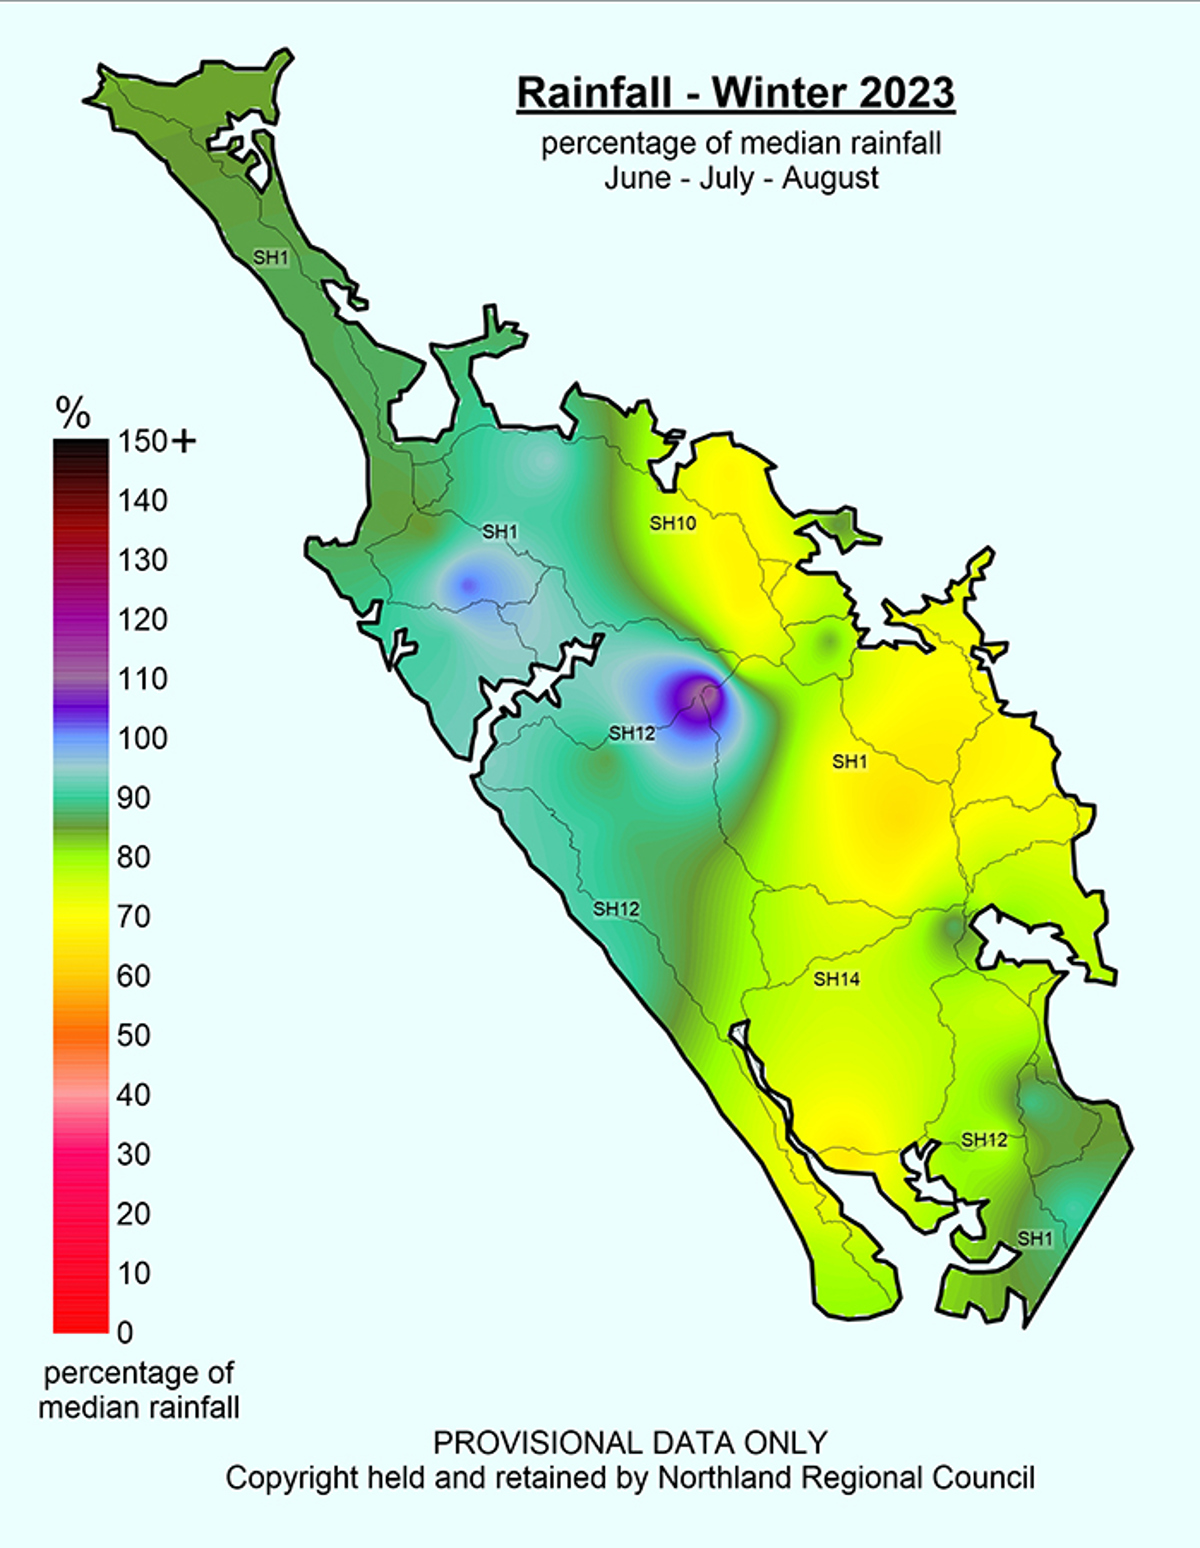
 Winter 2023 Rainfall Median Percentages
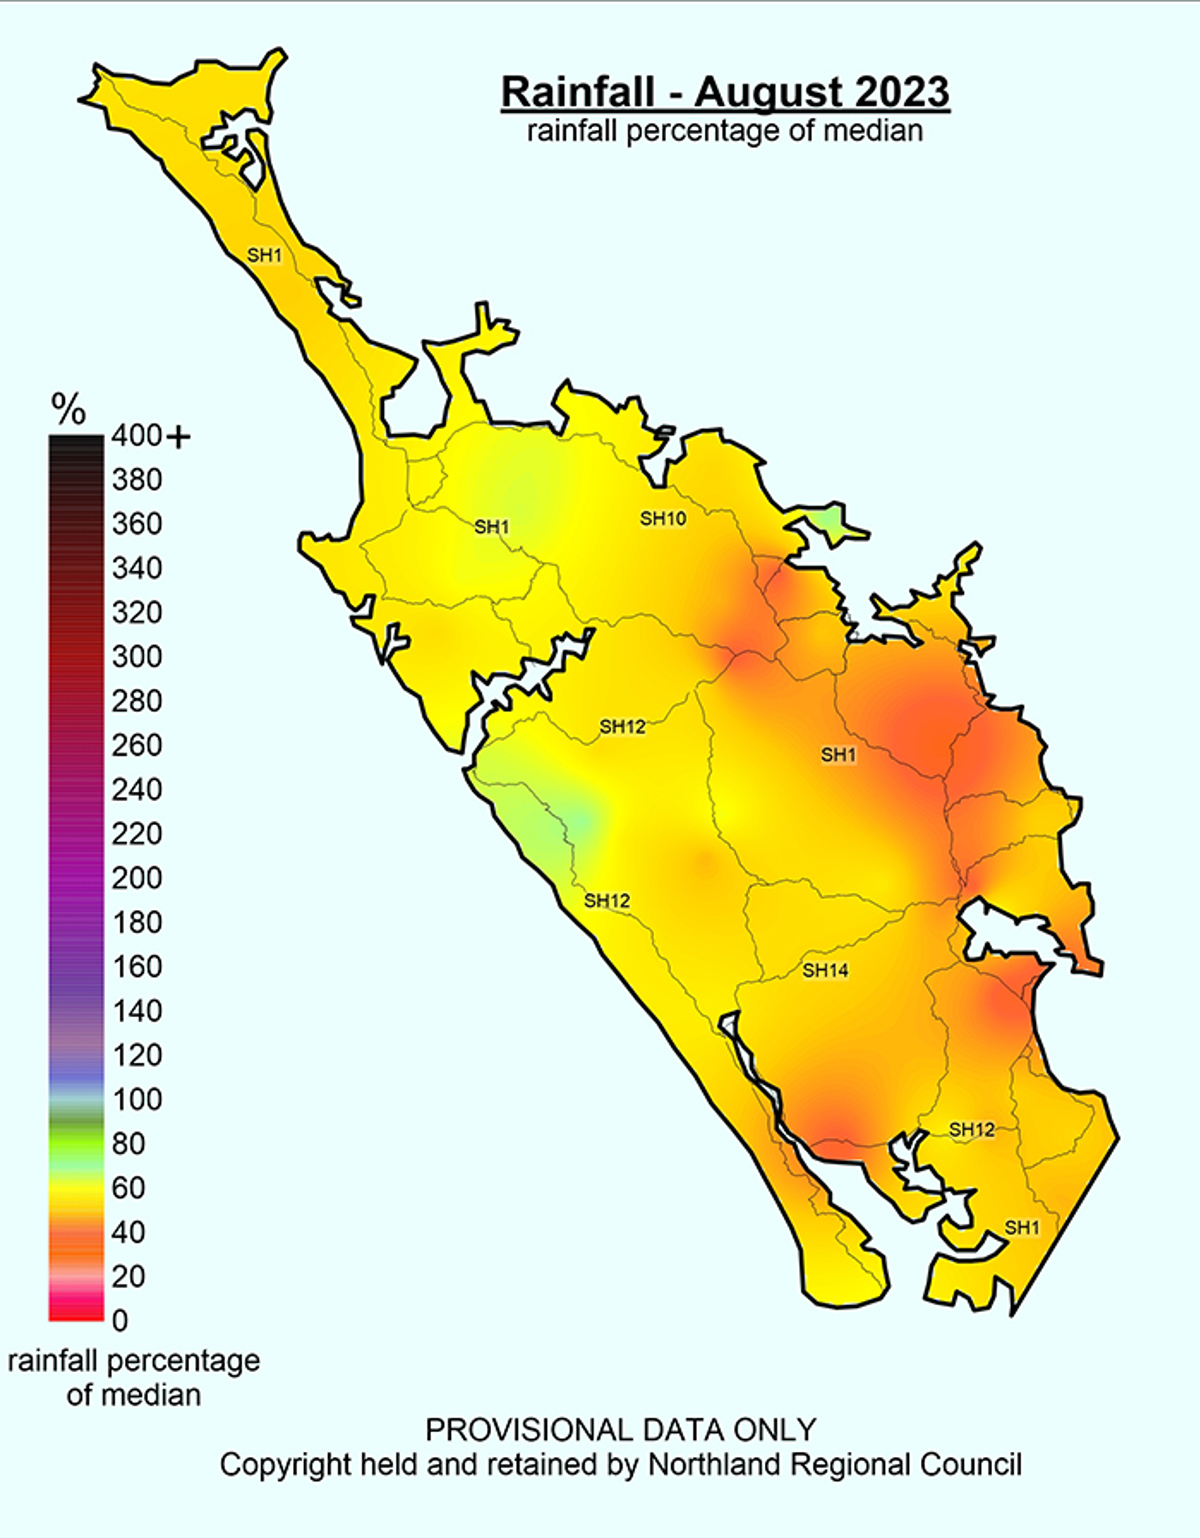
 August 2023 Rainfall Median Percentages
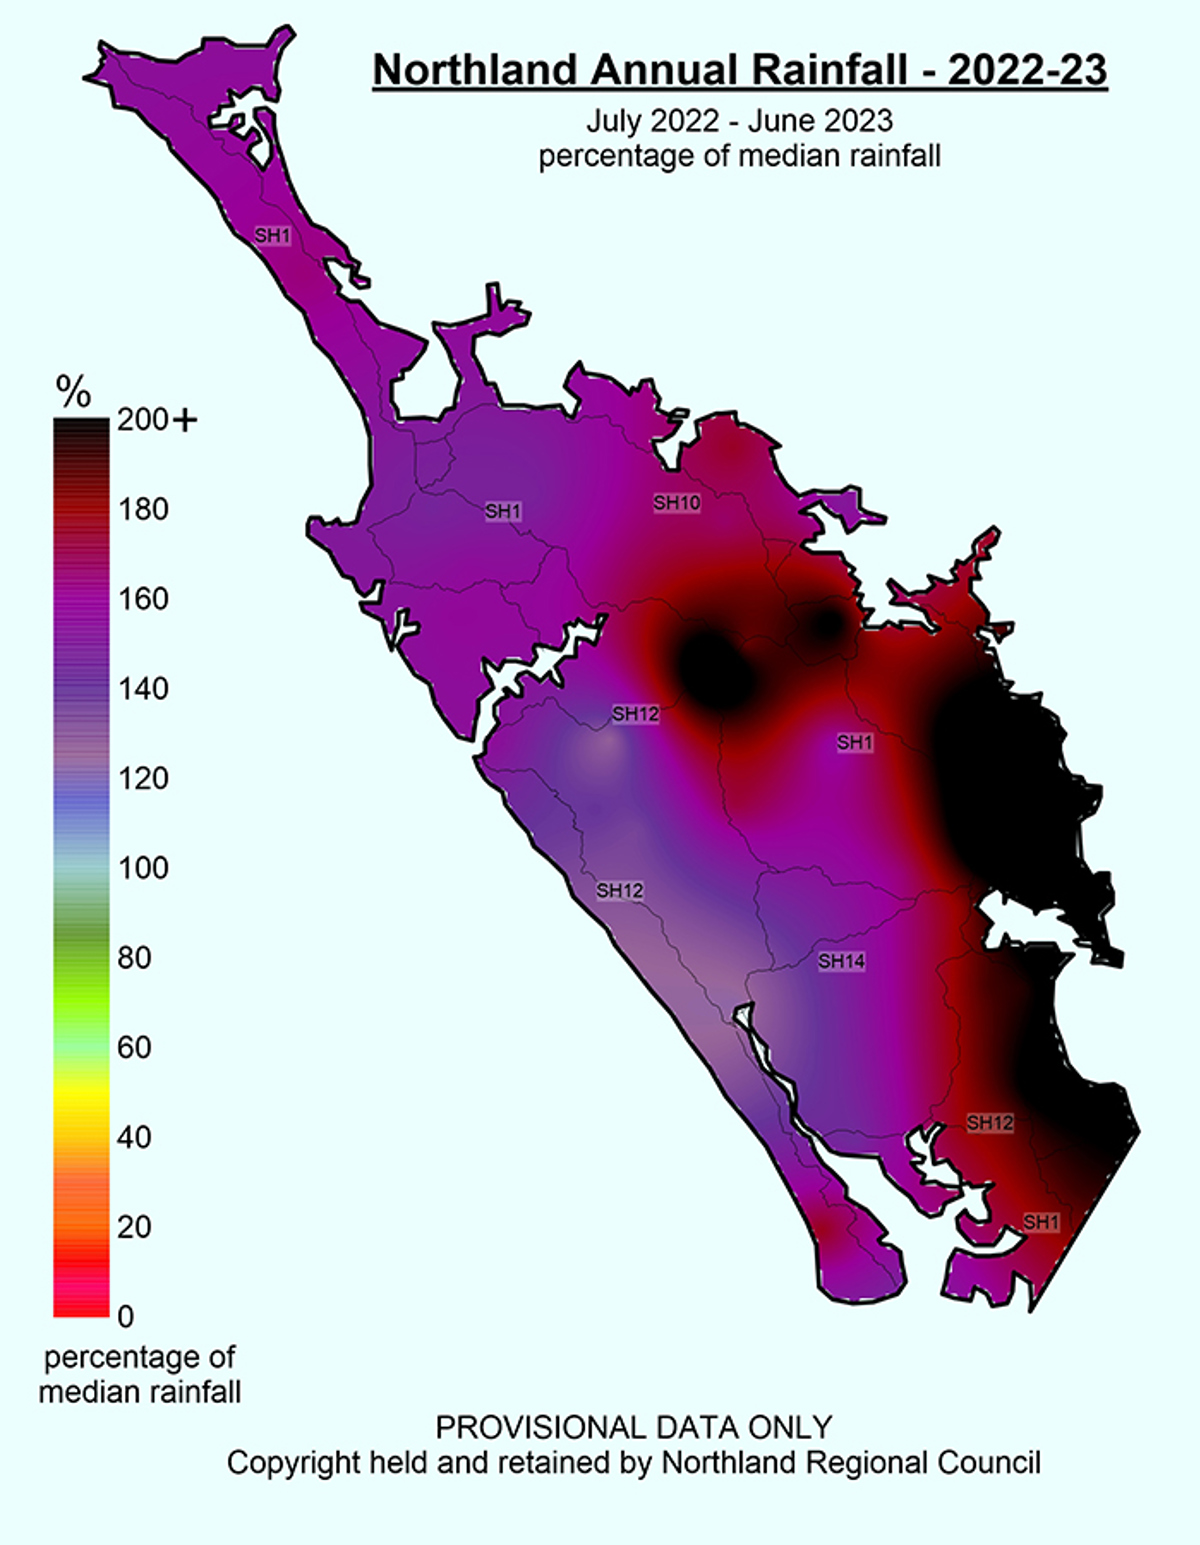
 July 2022 June 2023 Annual Rainfall Percentage Of Median
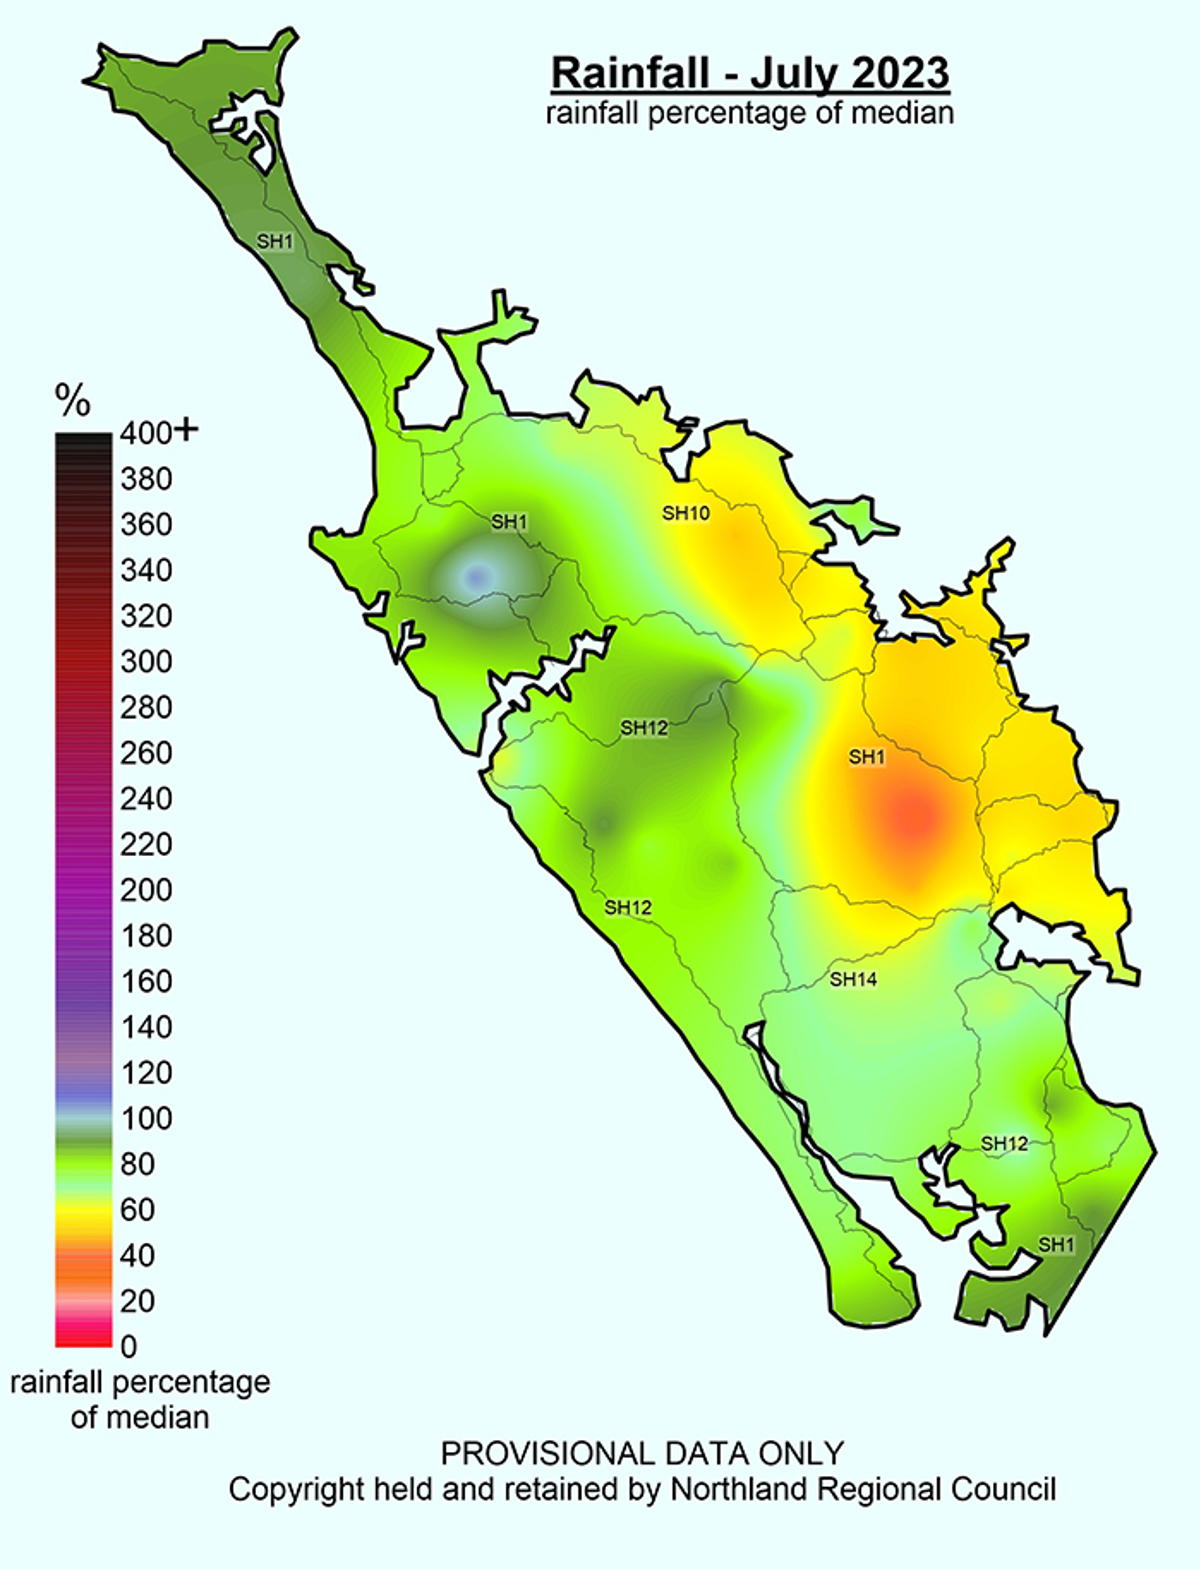
 July 2023 Rainfall Median Percentage
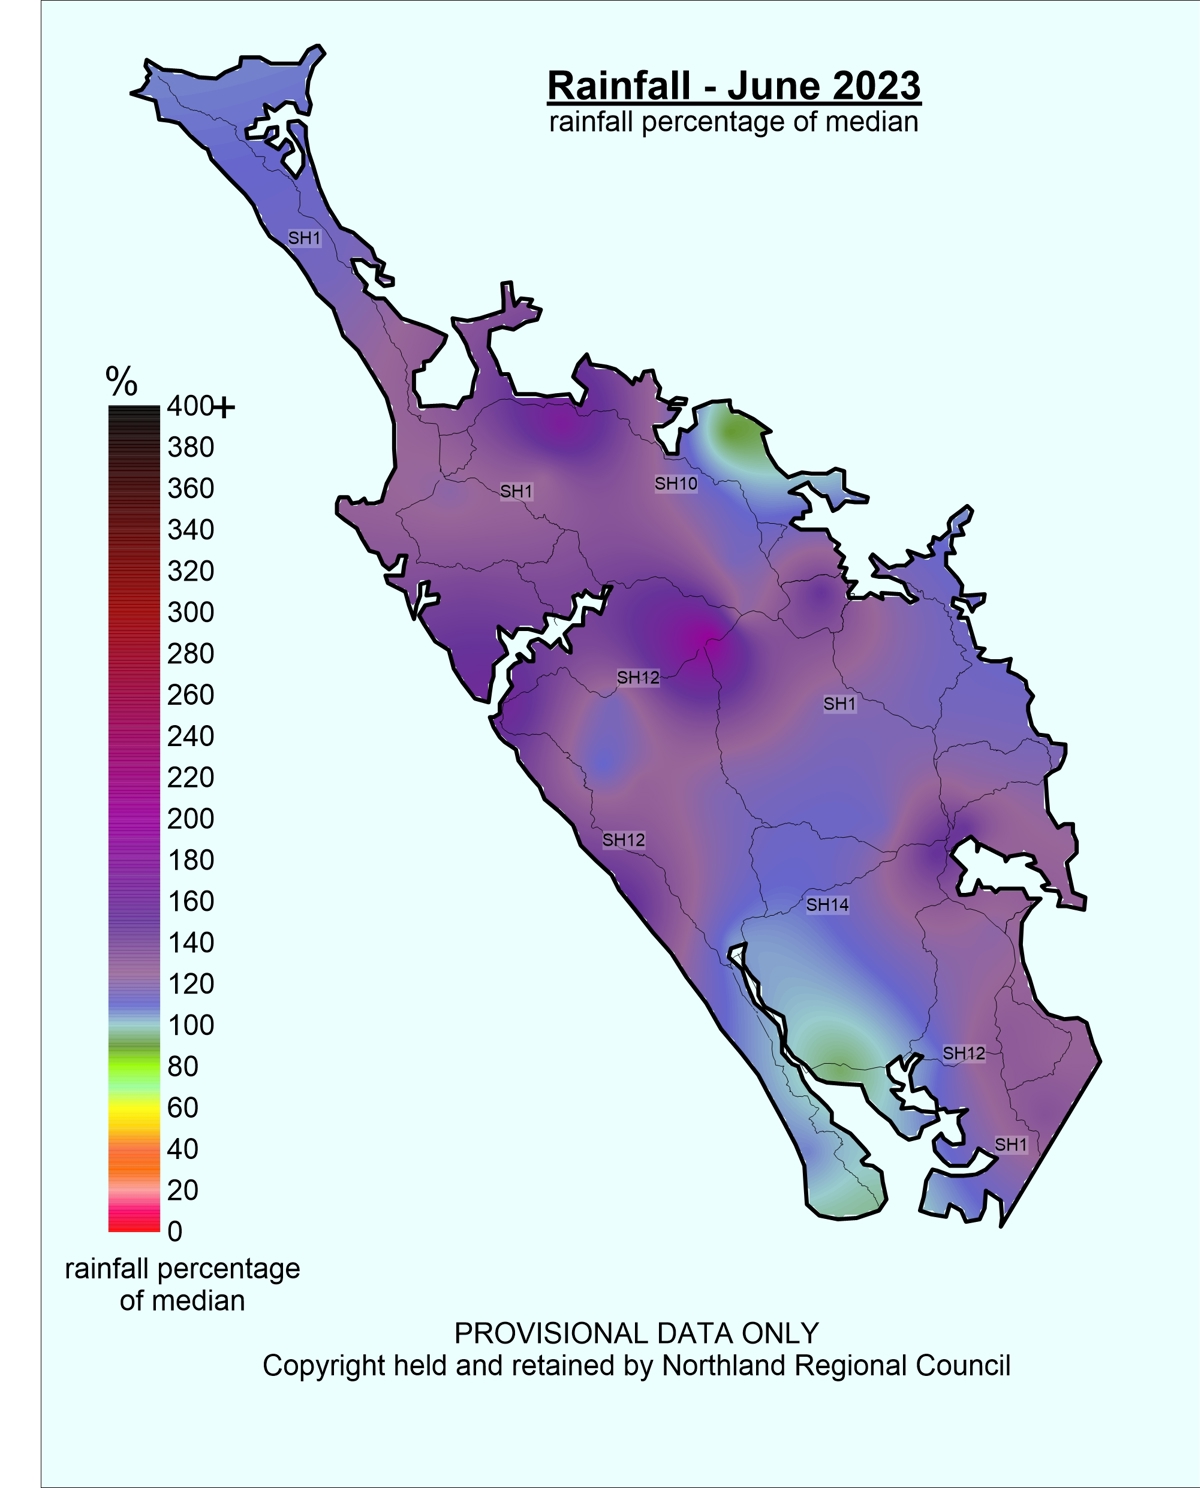
 June 2023 Median Percentage Rainfall
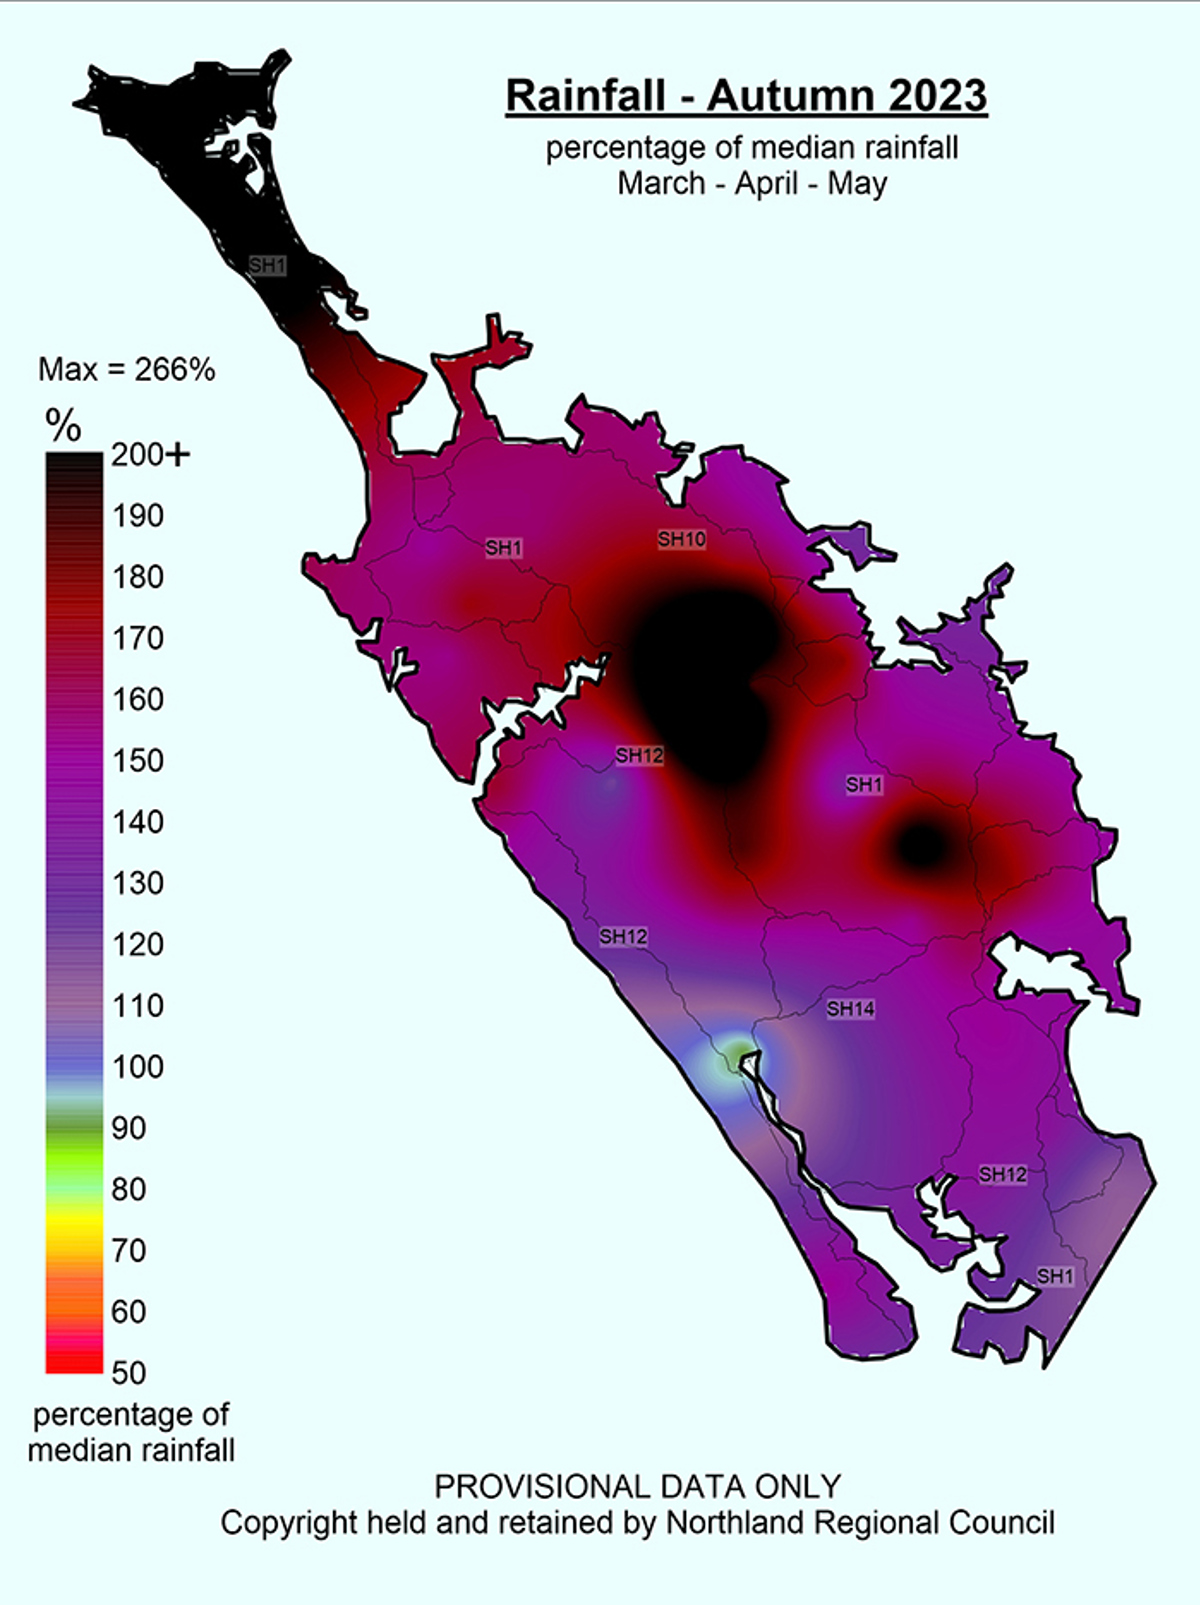
 Autumn March April May 2023 Median Rainfall Percentages
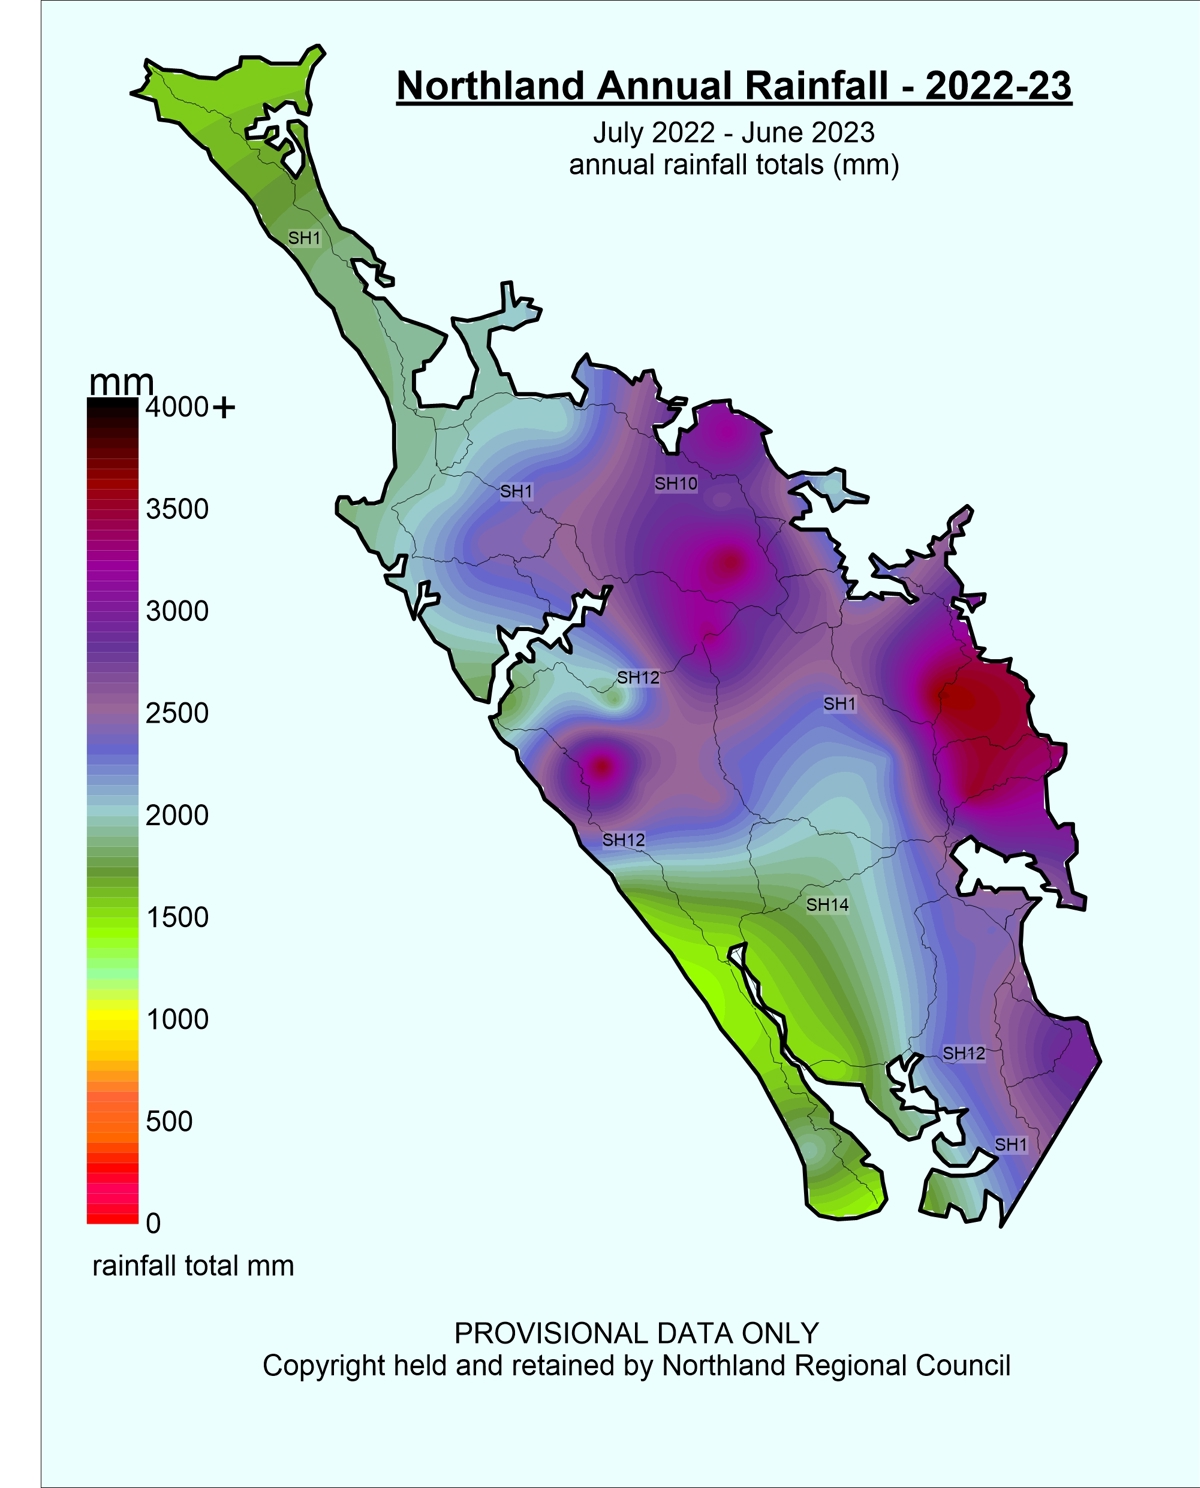
 2022 23 Annual Rainfall Totals
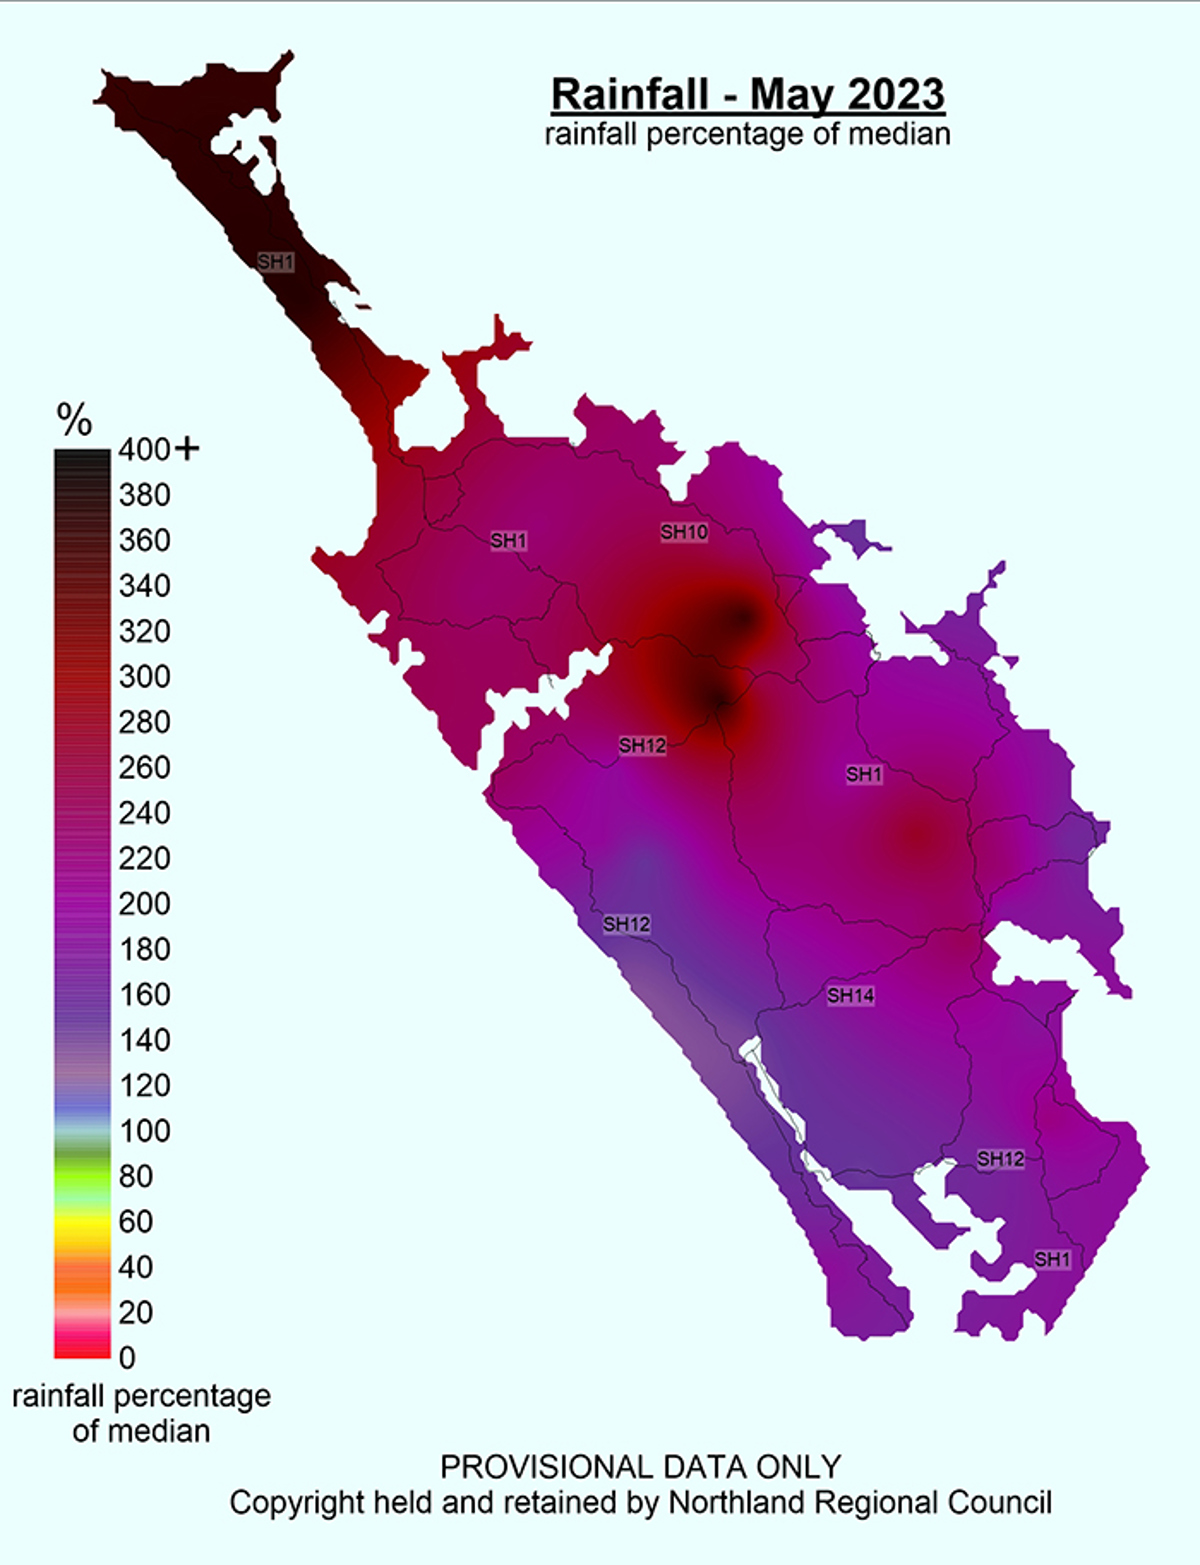
 May 2023 Rainfall Median Percentages
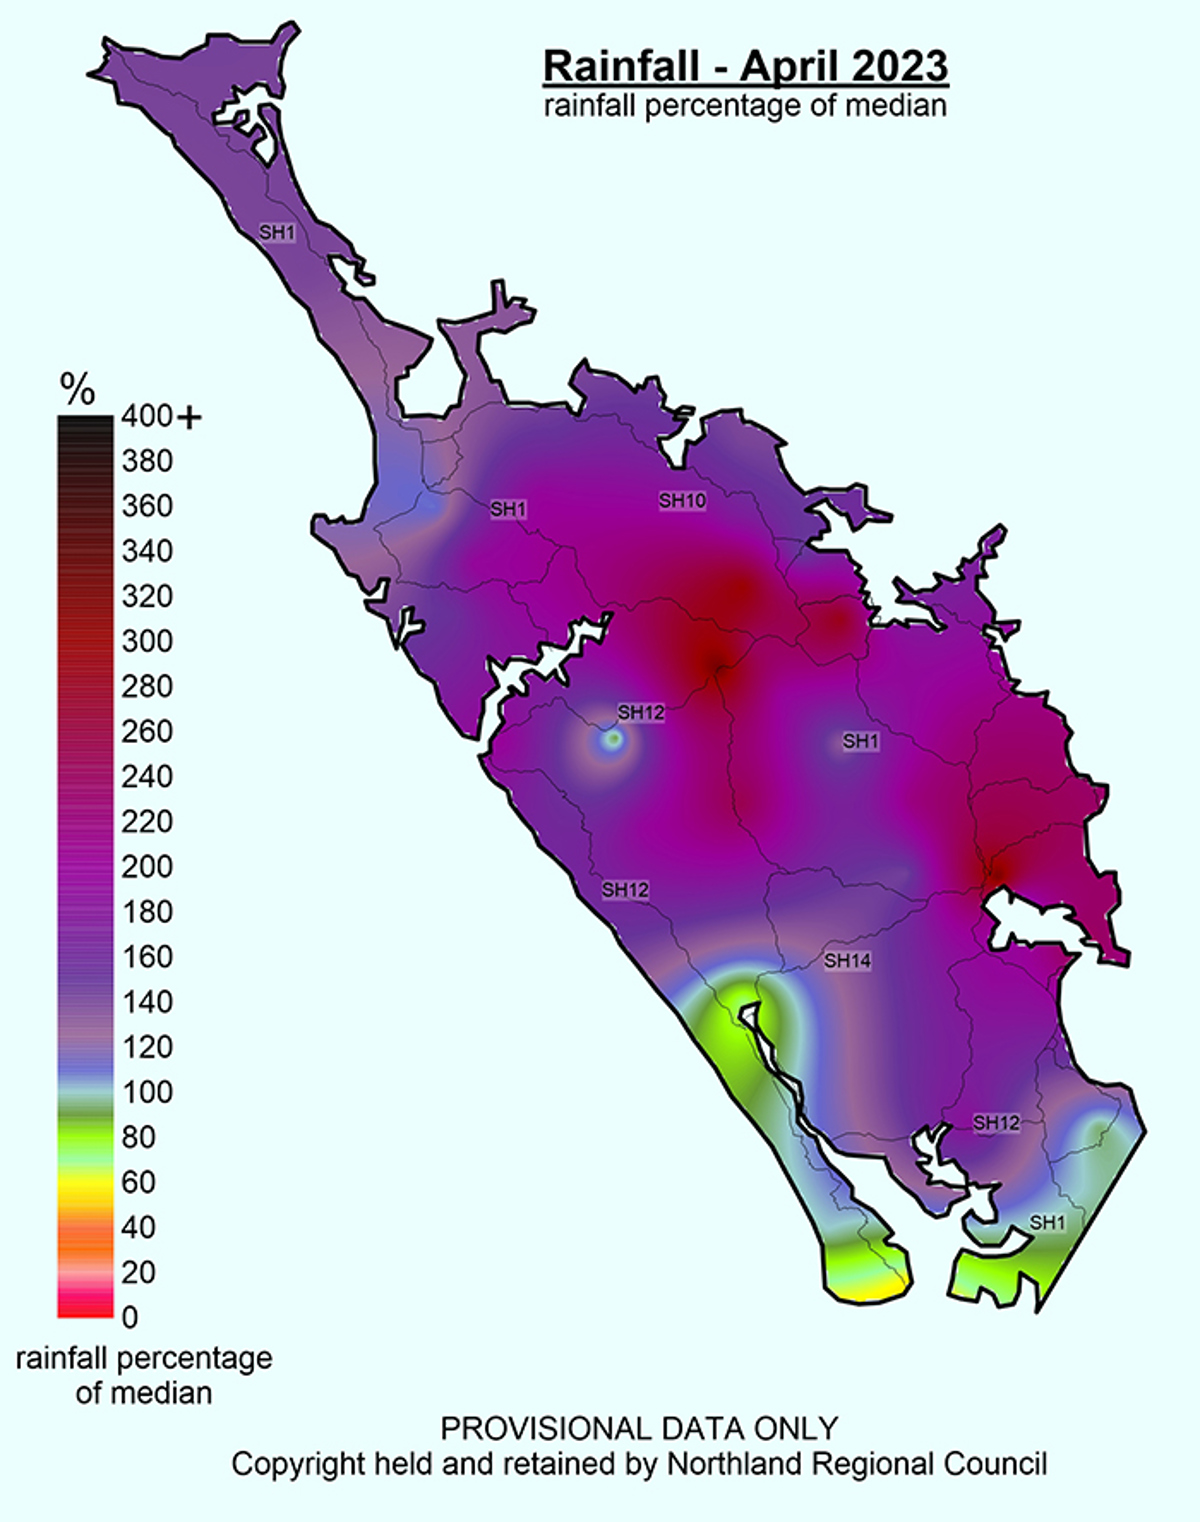
 April 2023 Rainfall Median Percentage
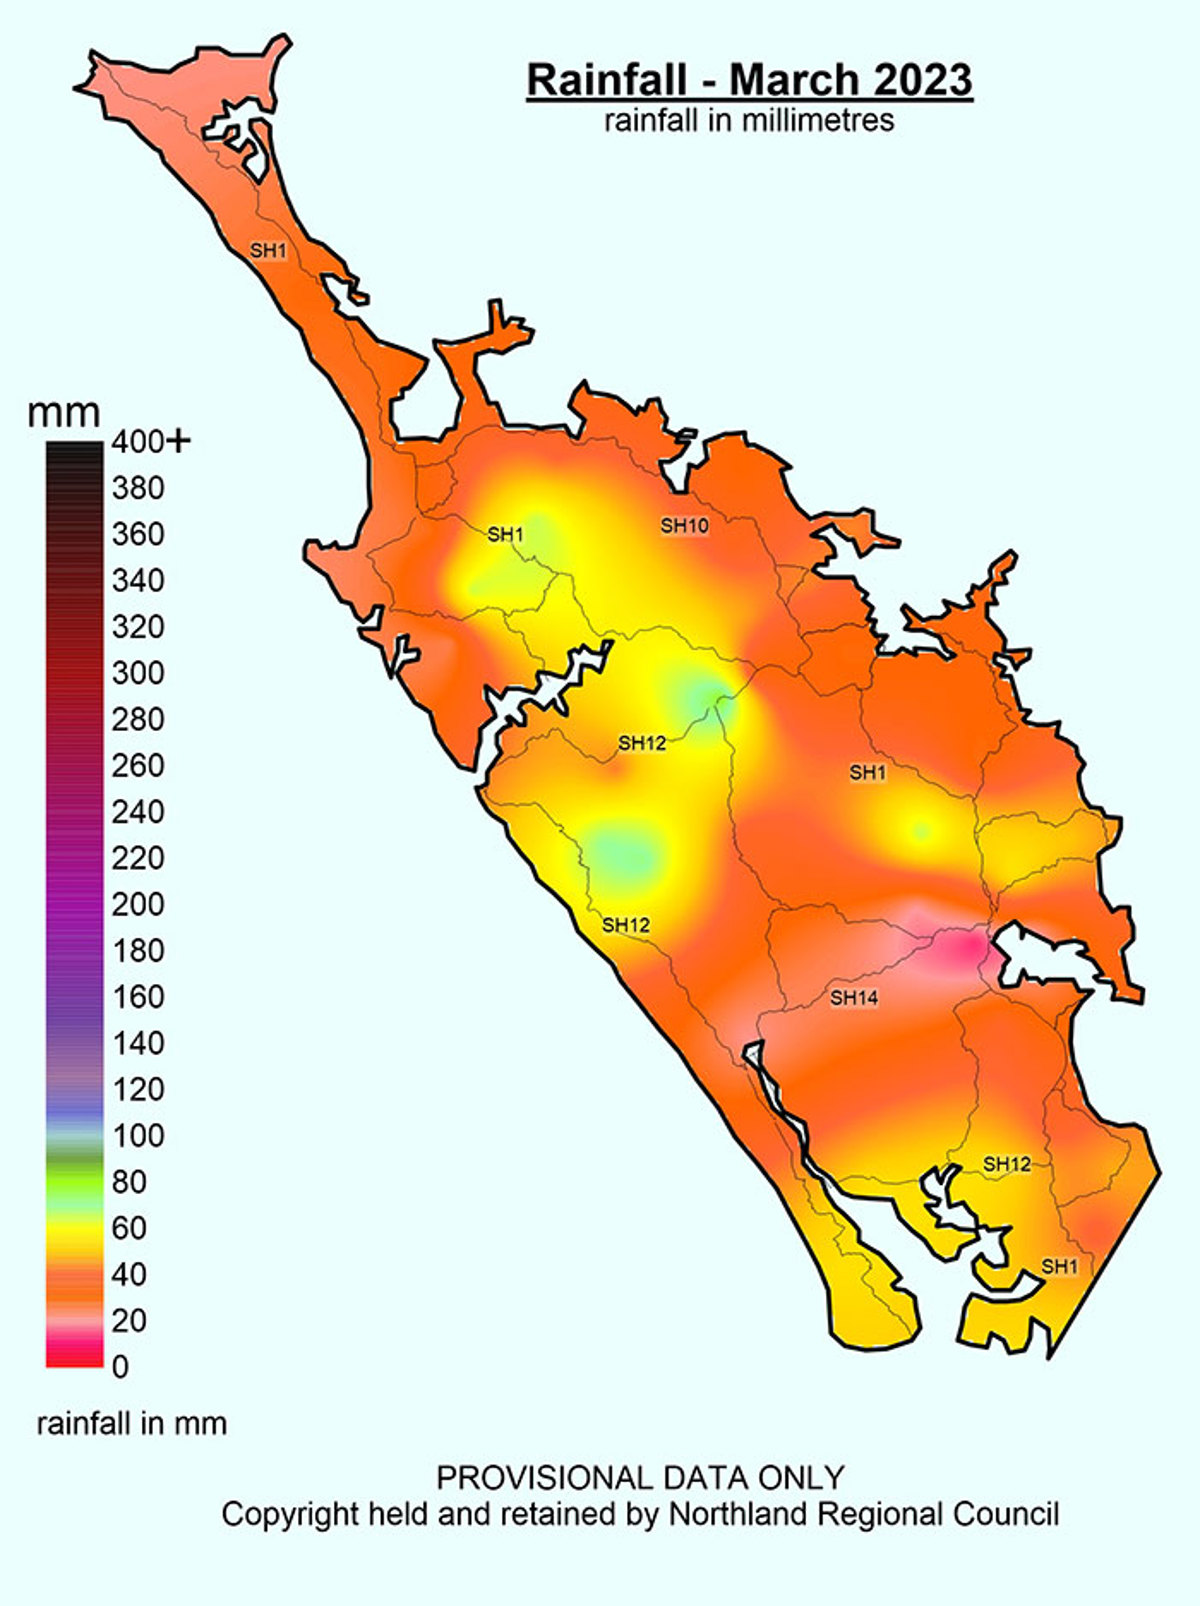
 March 2023 Rainfall Median Percentages
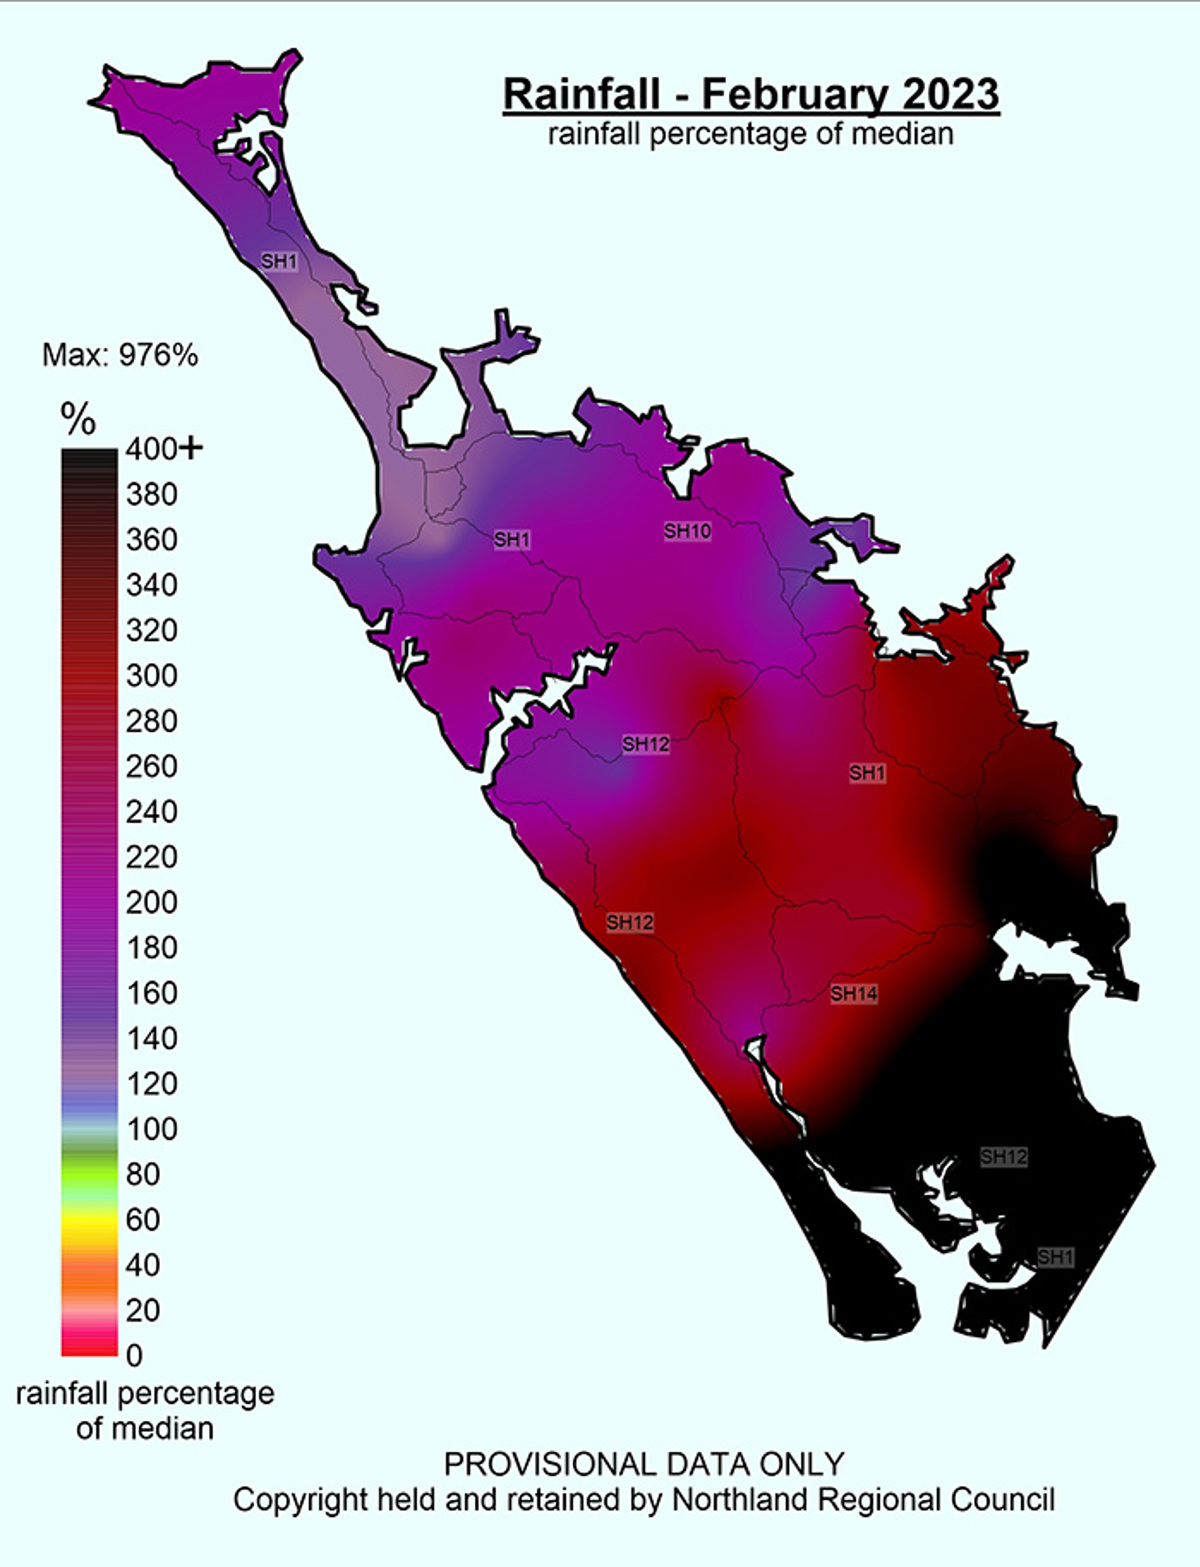
 February 2023 Rainfall Median Percentages
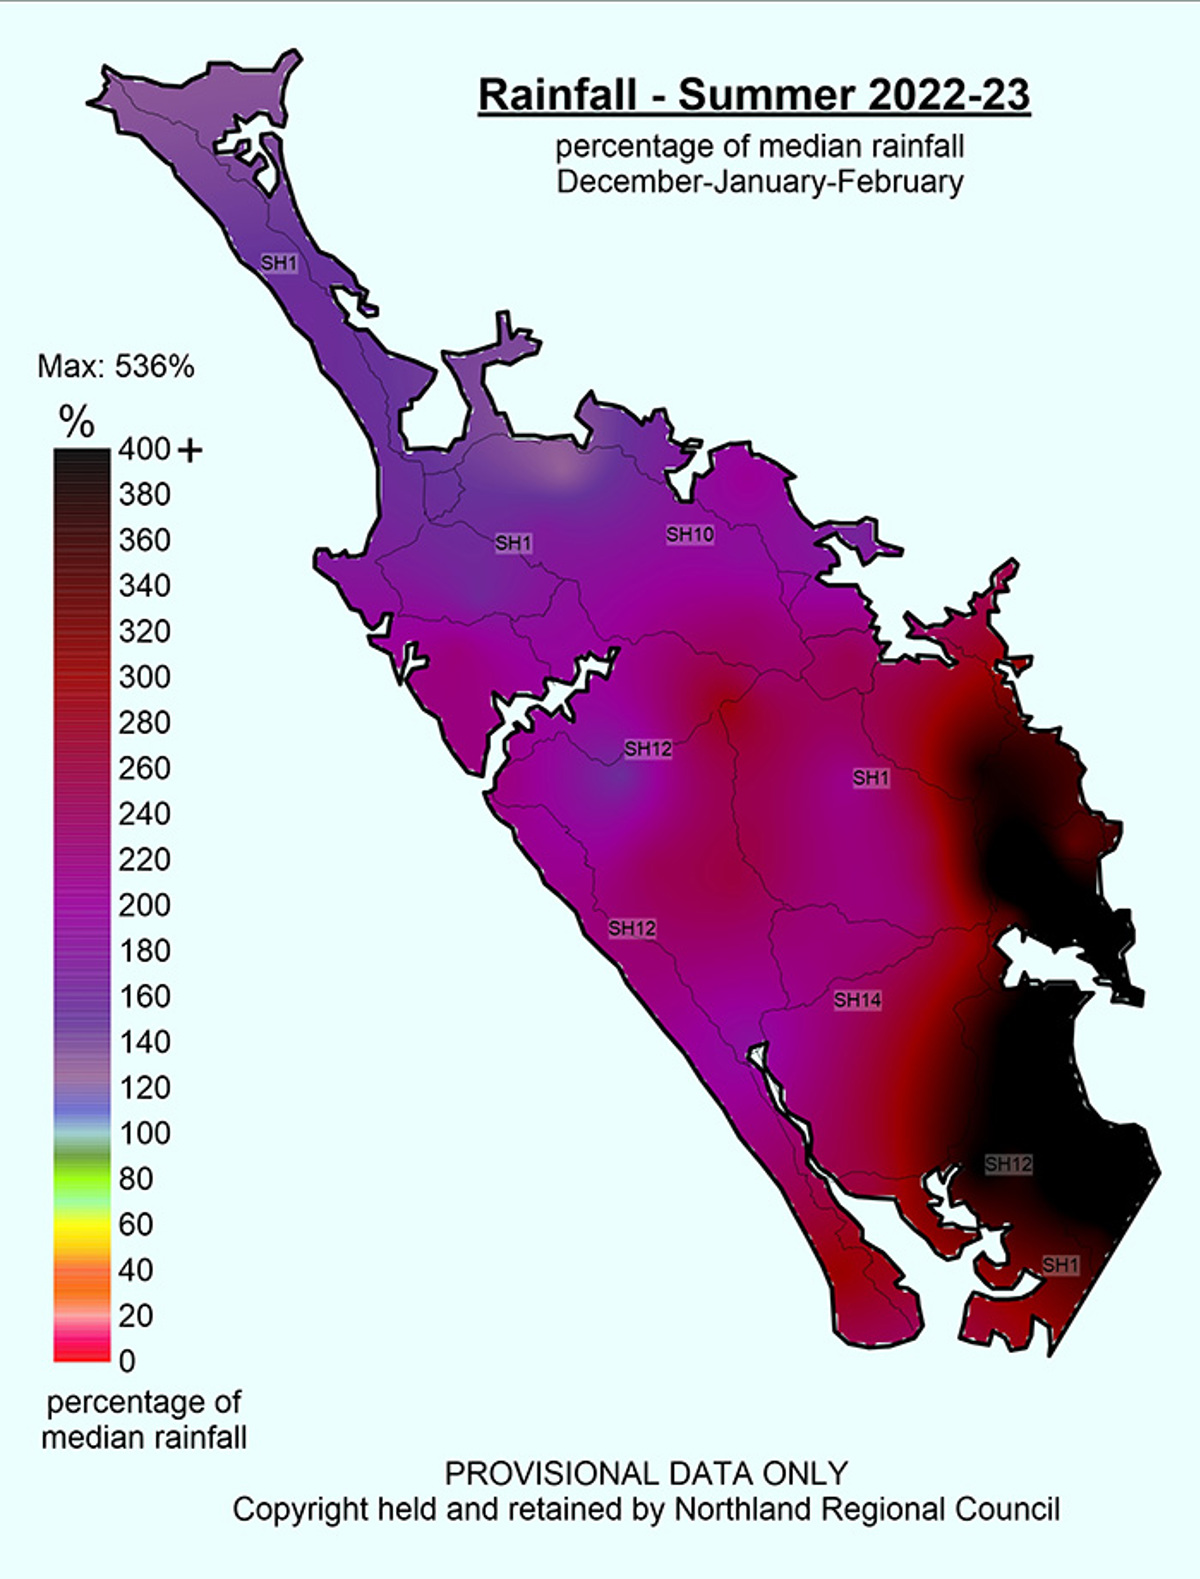
 Summer 2022 23
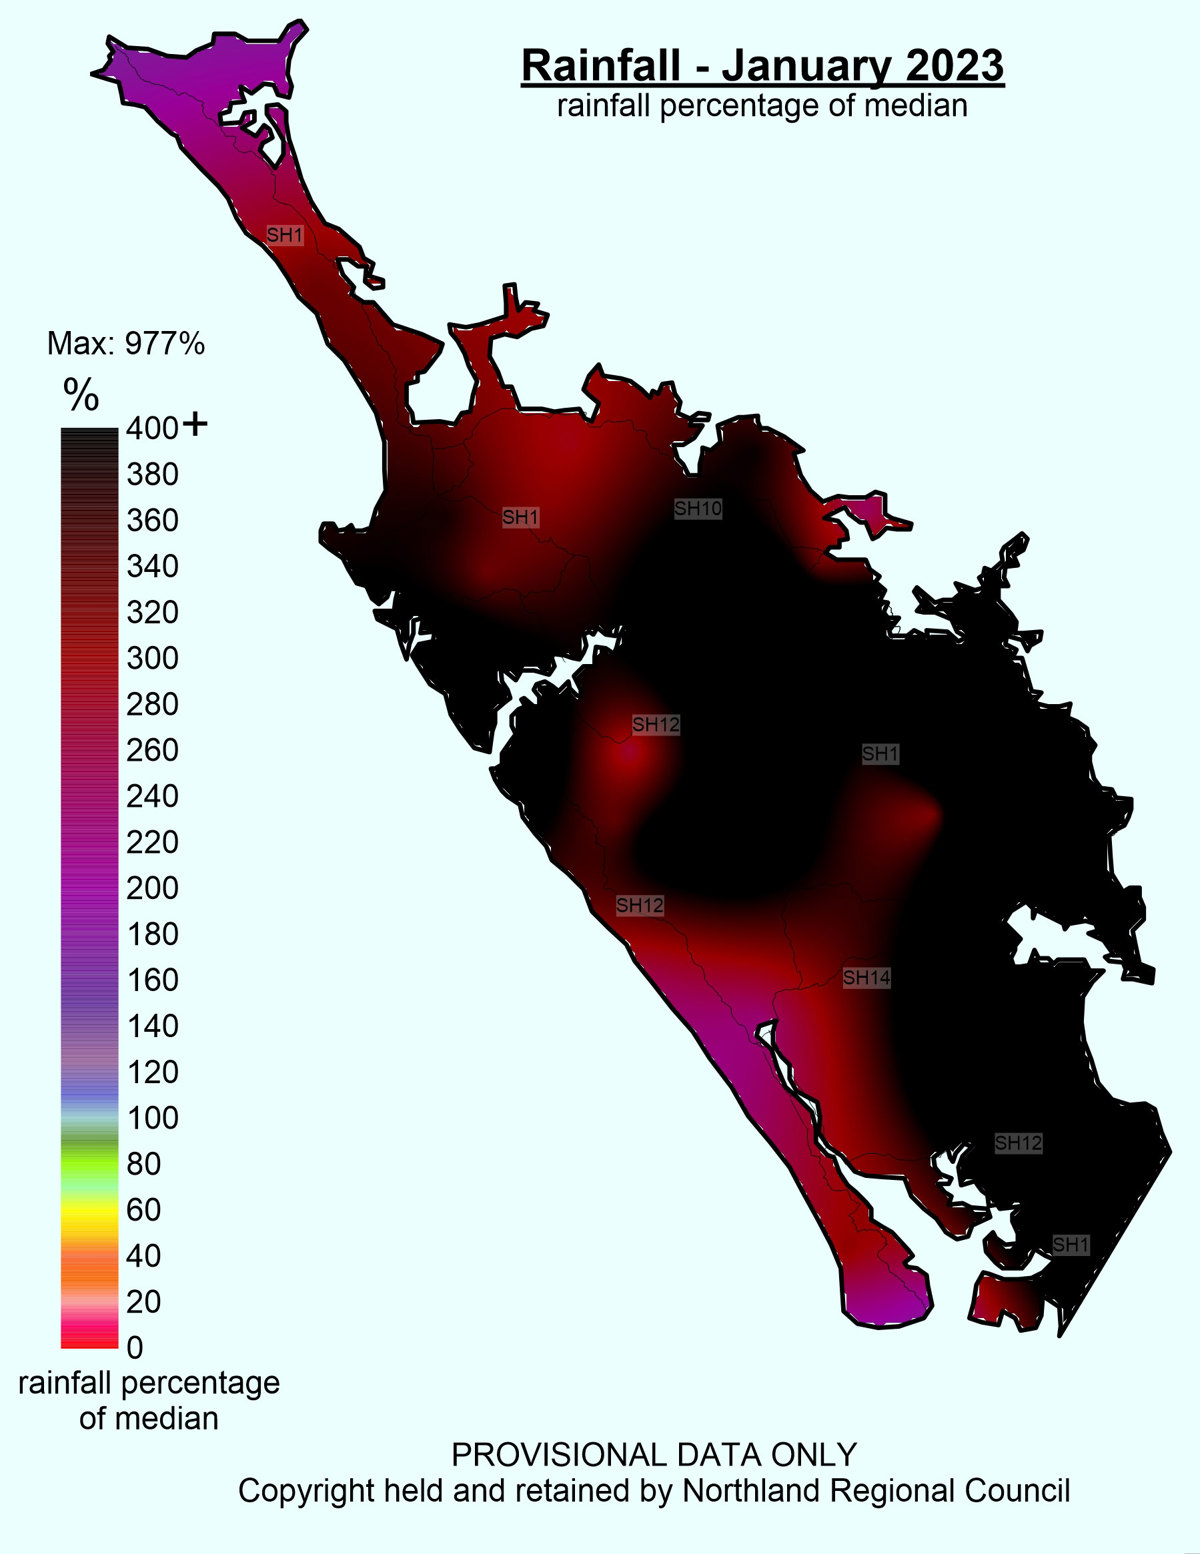
 January 2023 Rainfall Median Percentages
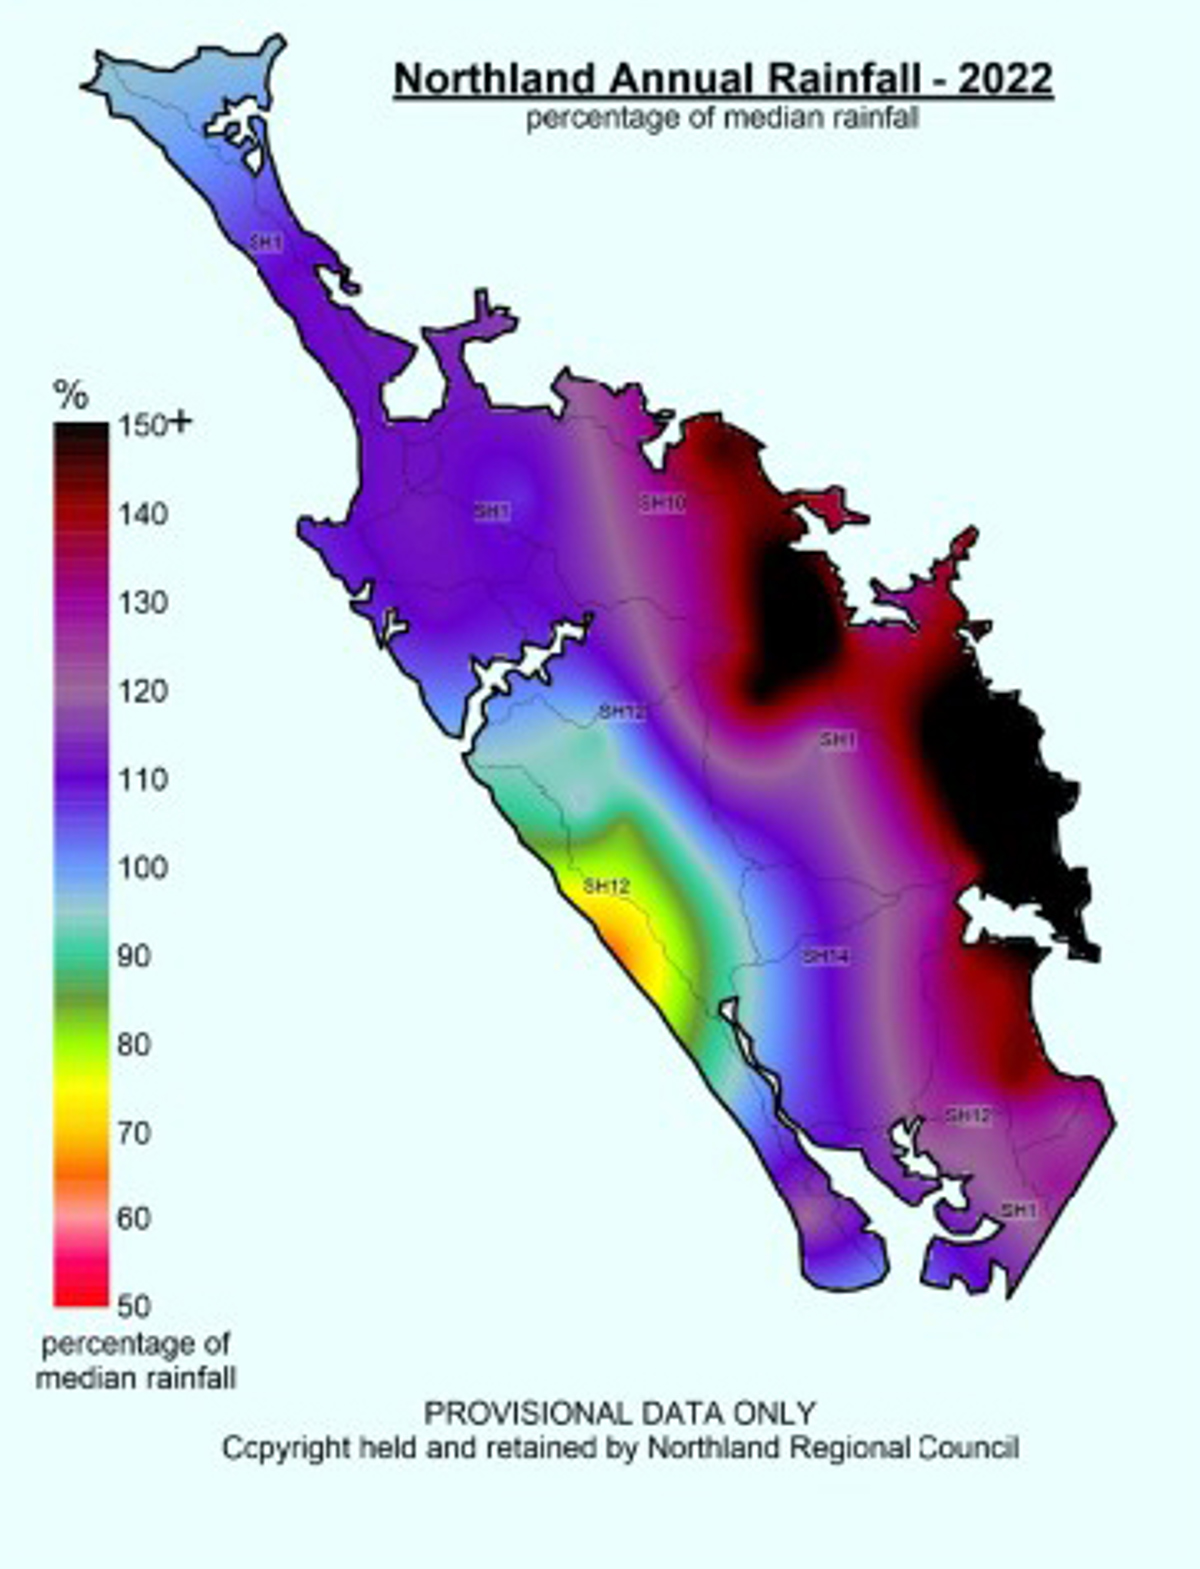
 Northland Annual Rainfall 2022
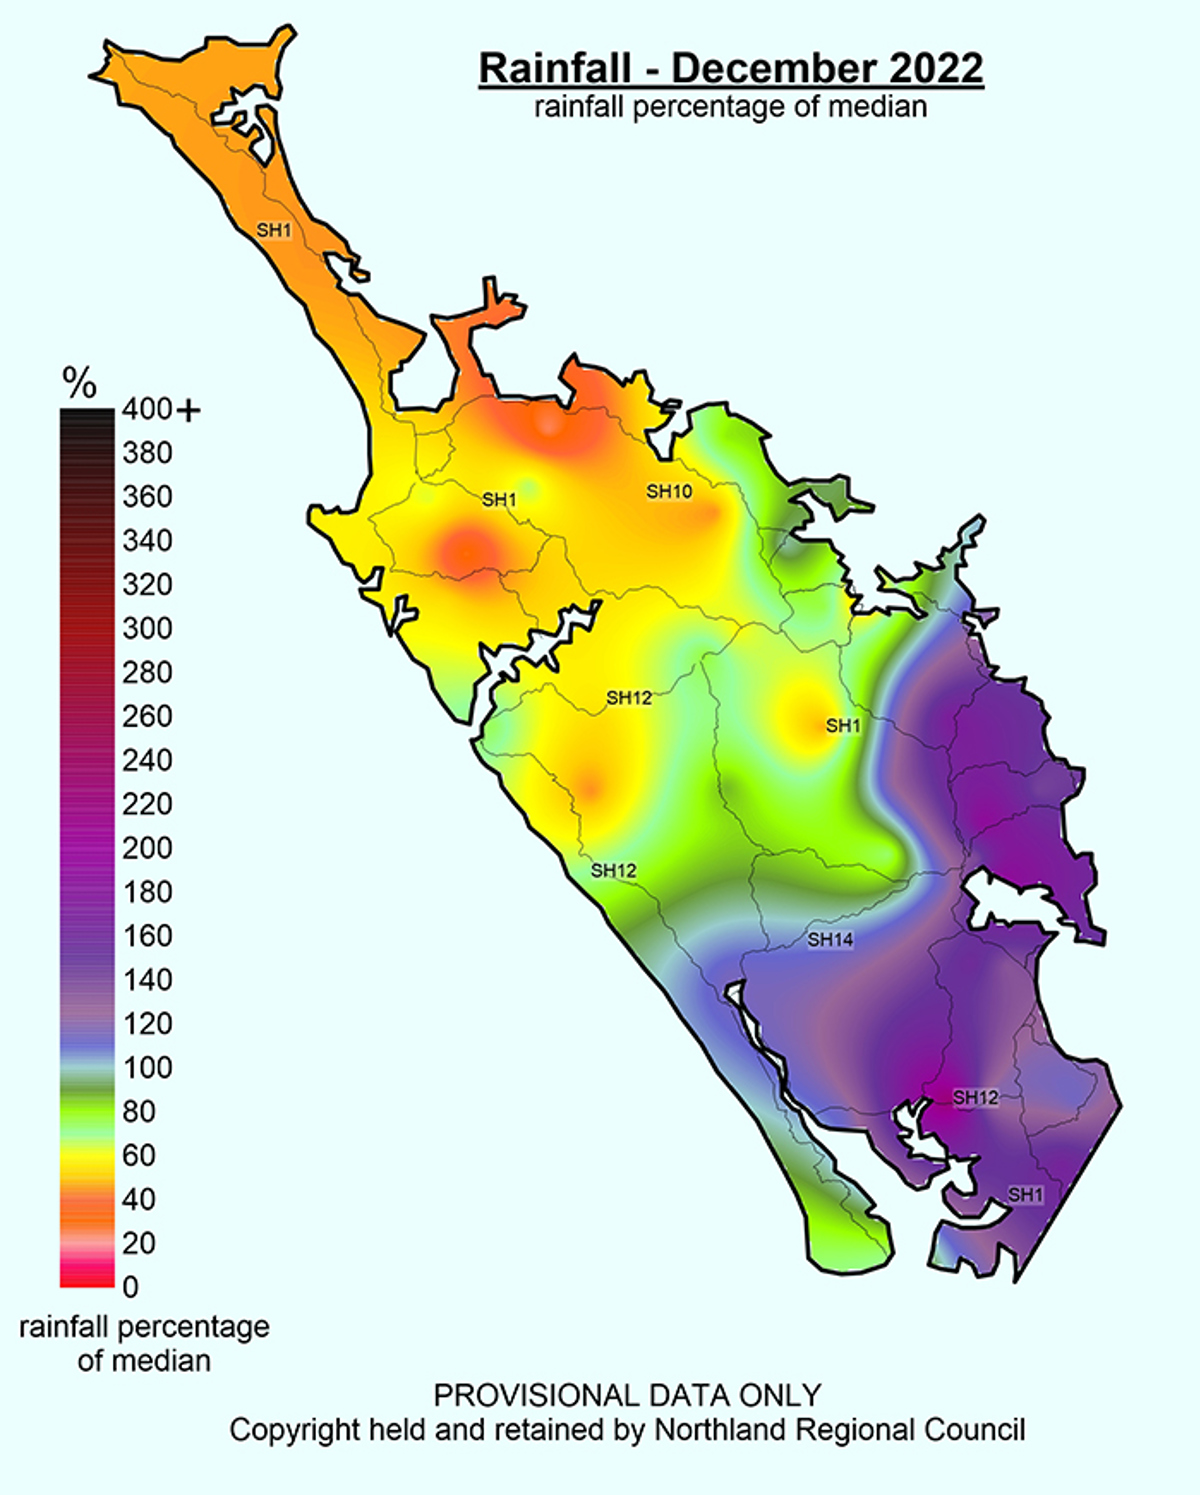
 December 2022 Rainfall percentage of median
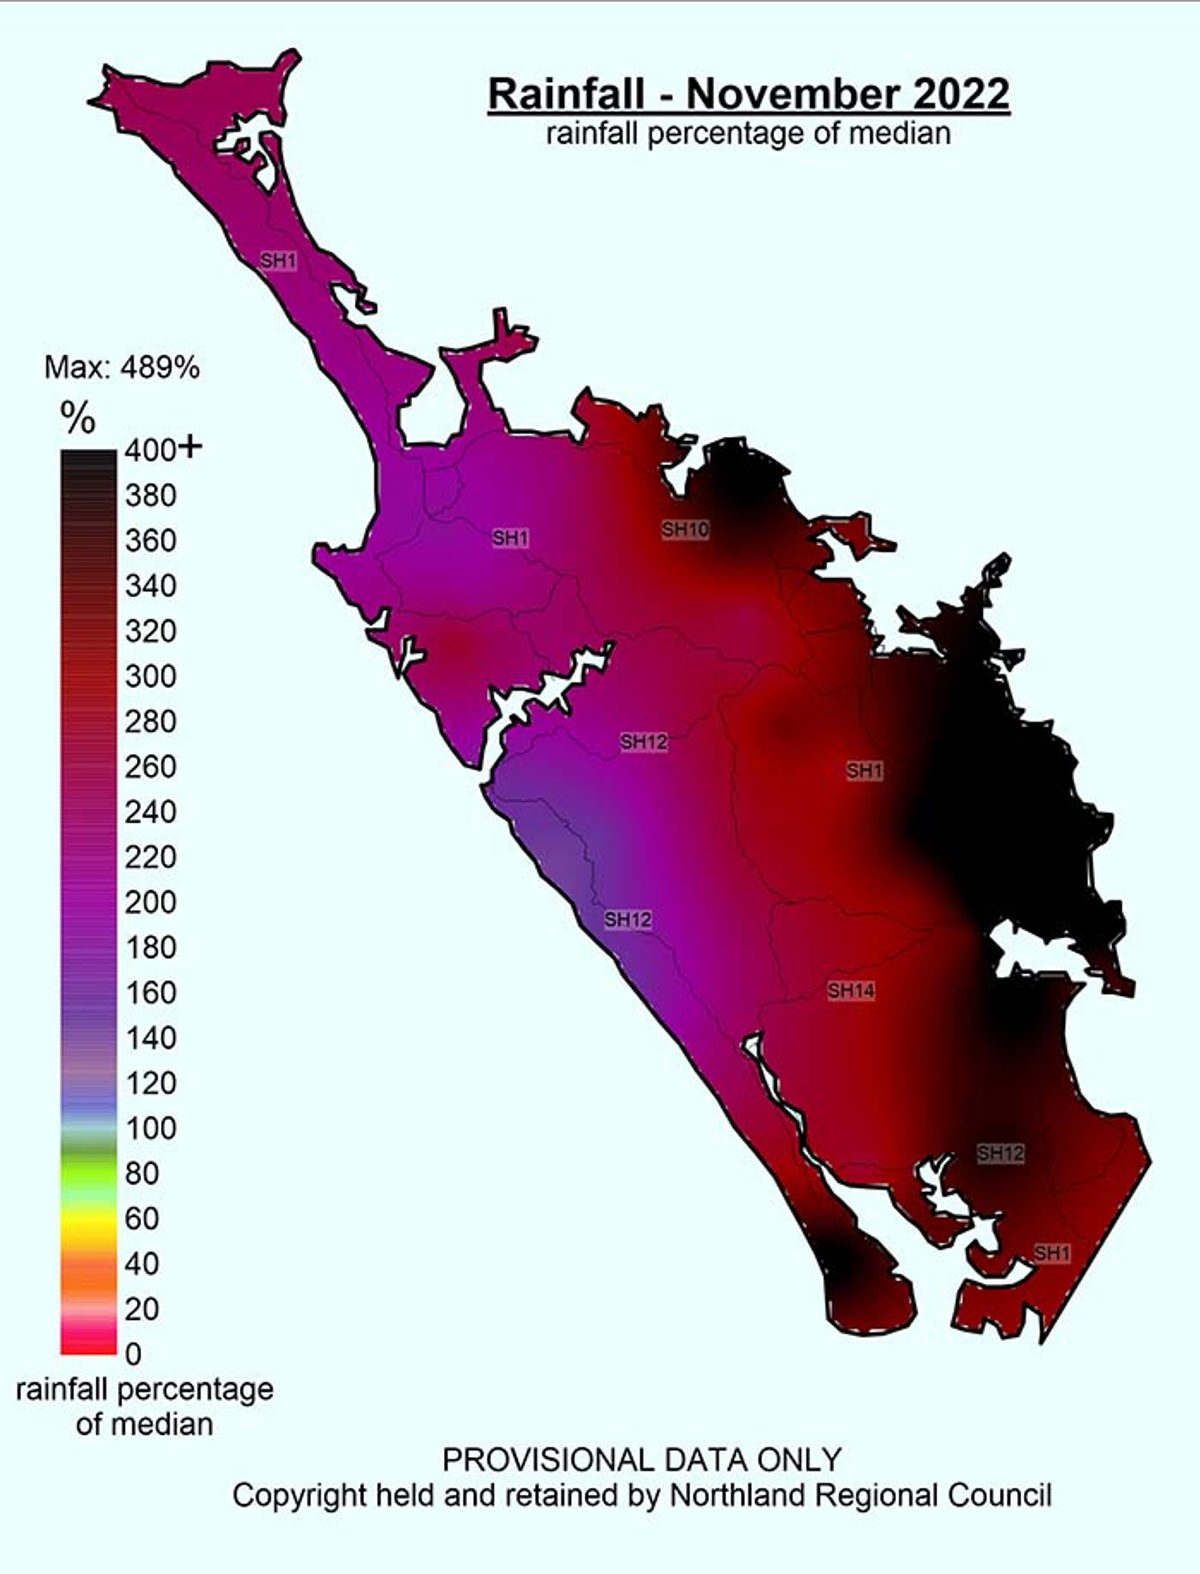
 November 2022 Rainfall Percentages Of Median
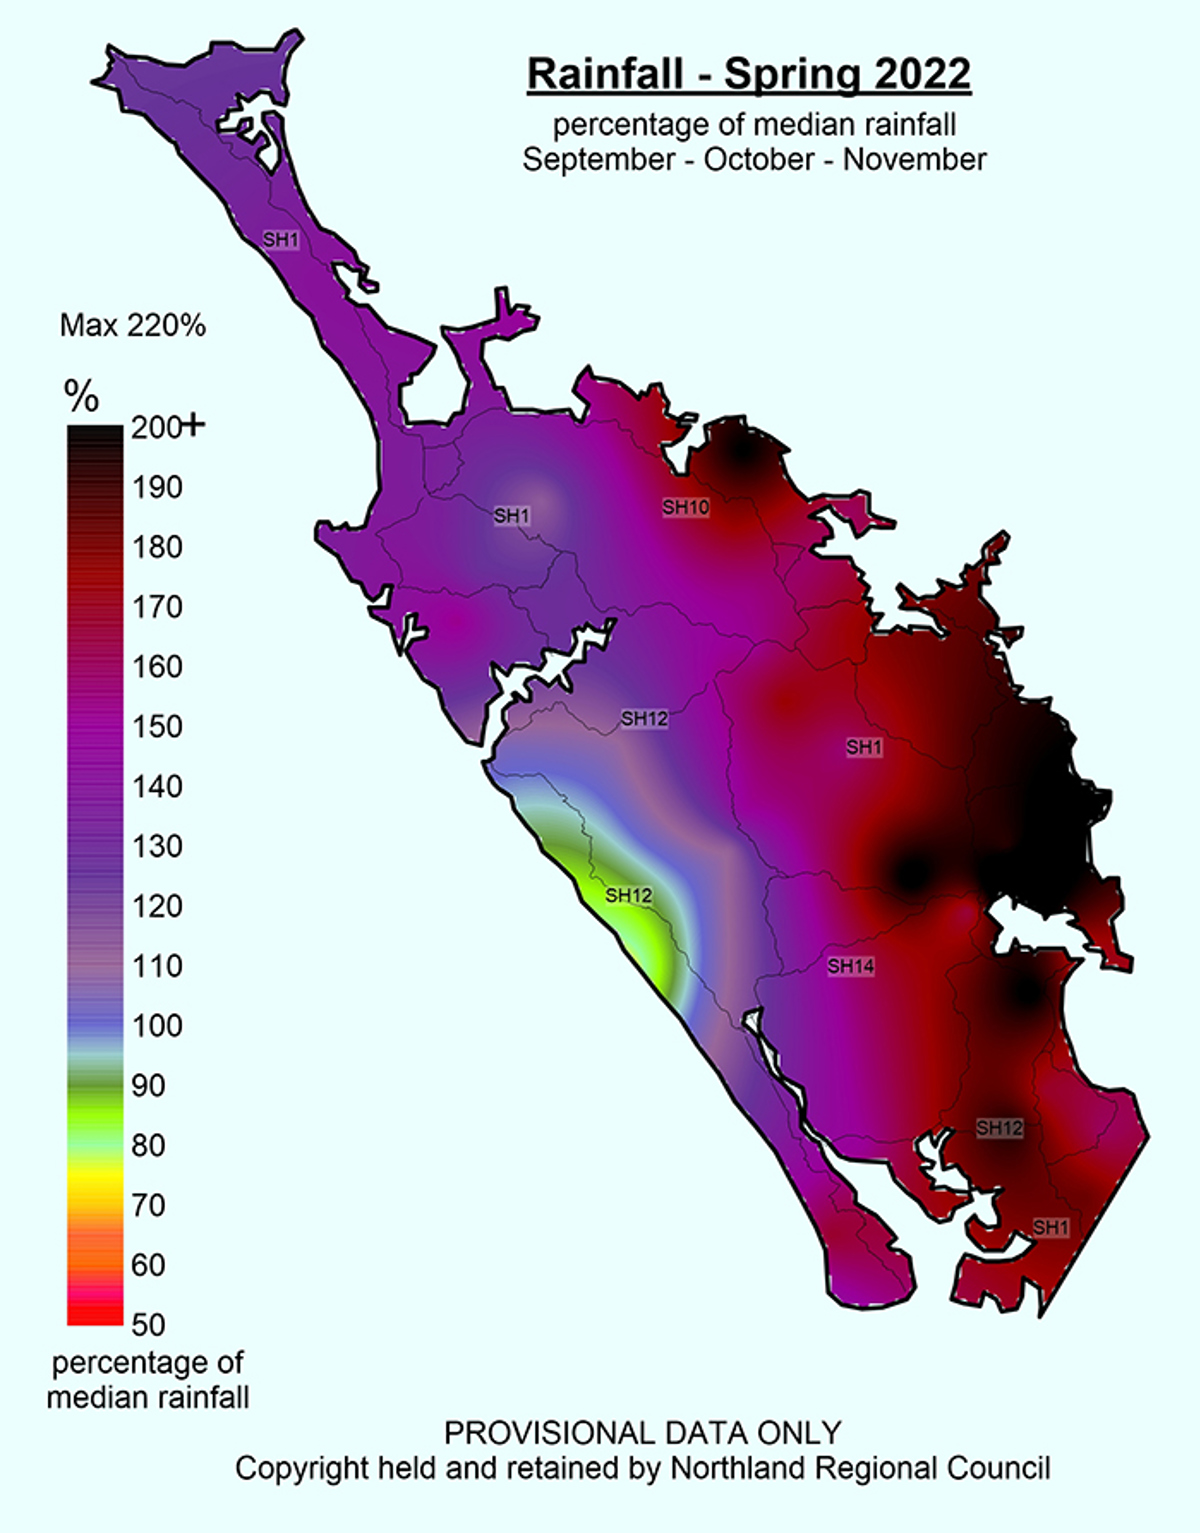
 Spring 2022 Median Rainfall Percentages
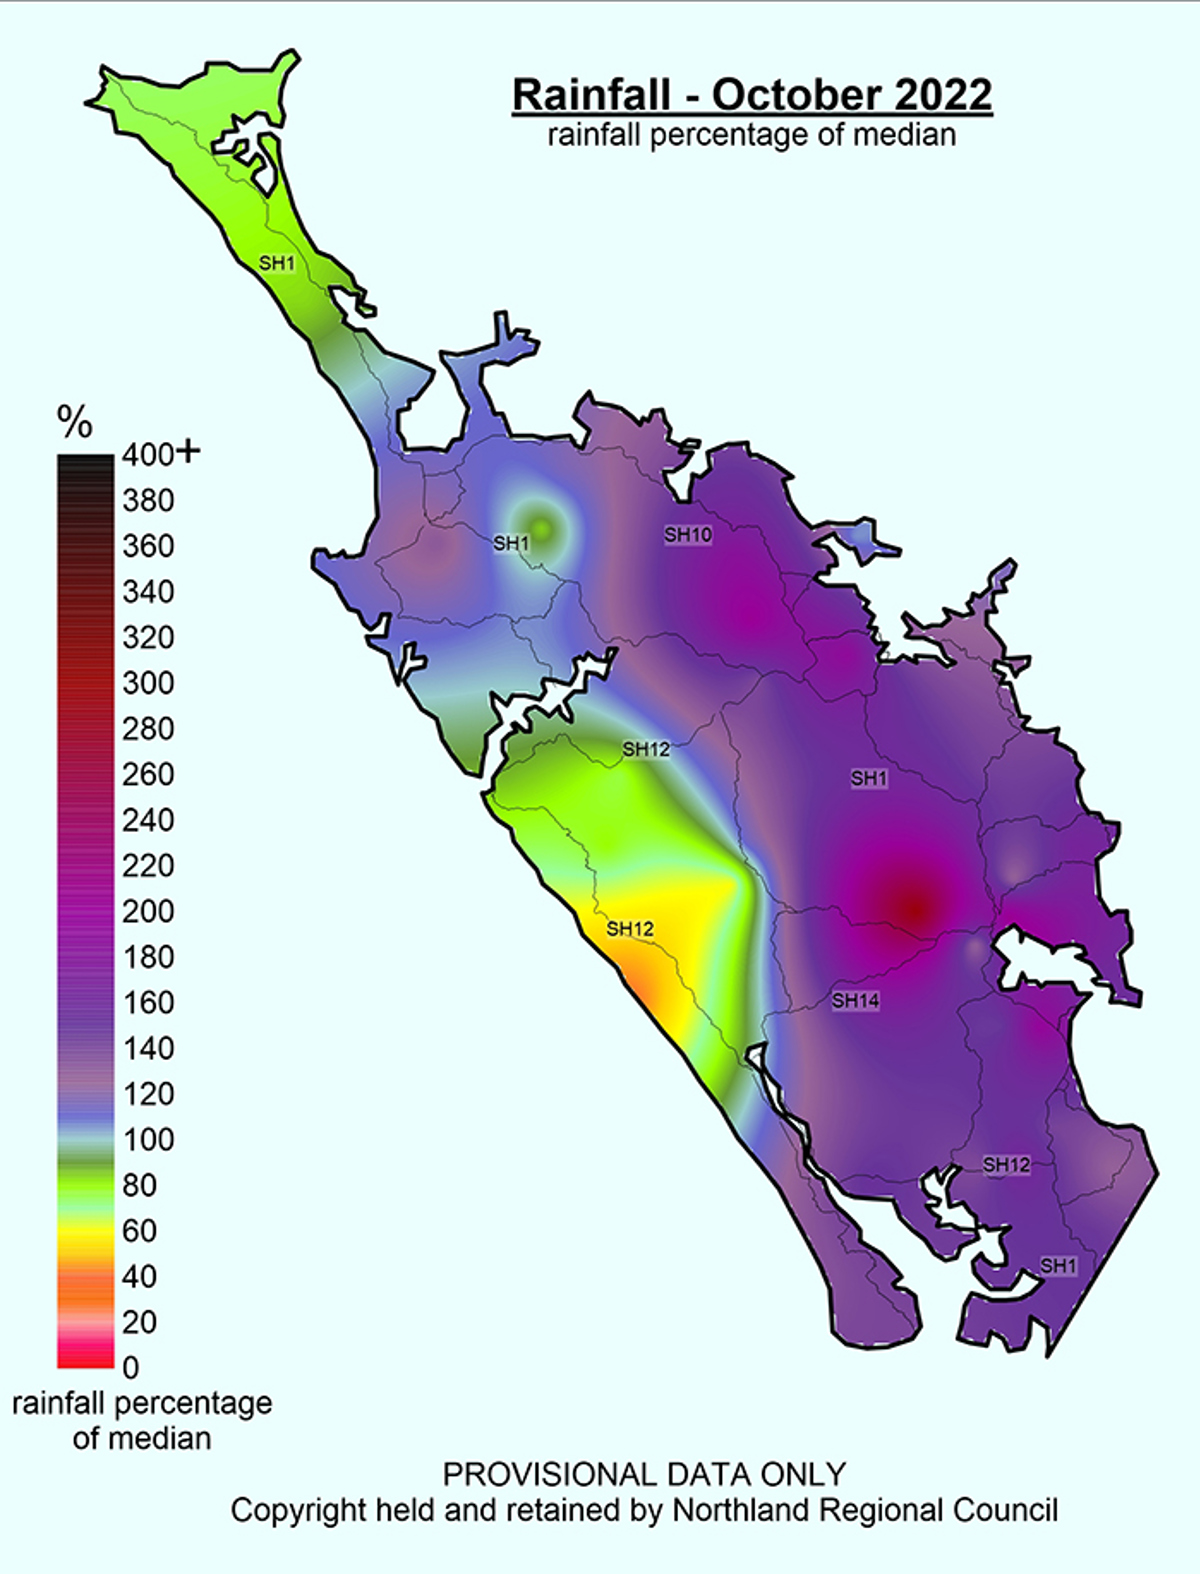
 October 2022 Rainfall Percentage Of Median
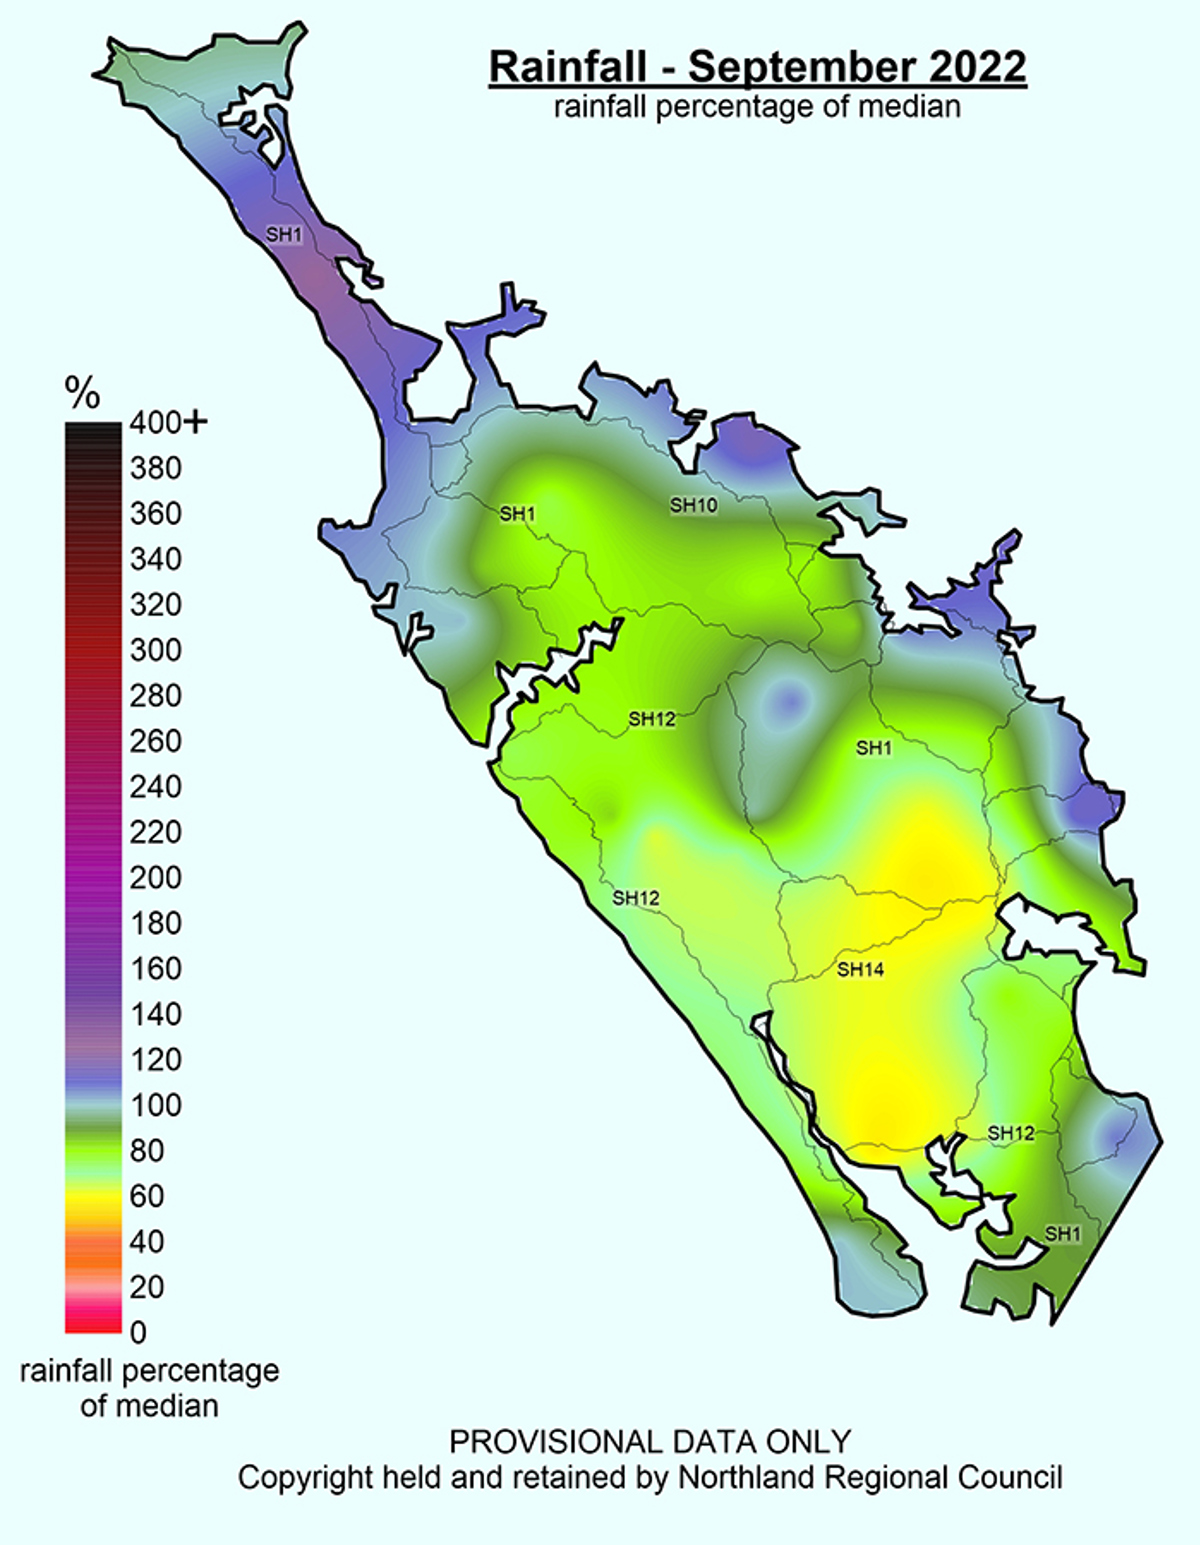
 September 2022 Rainfall Median Percentages
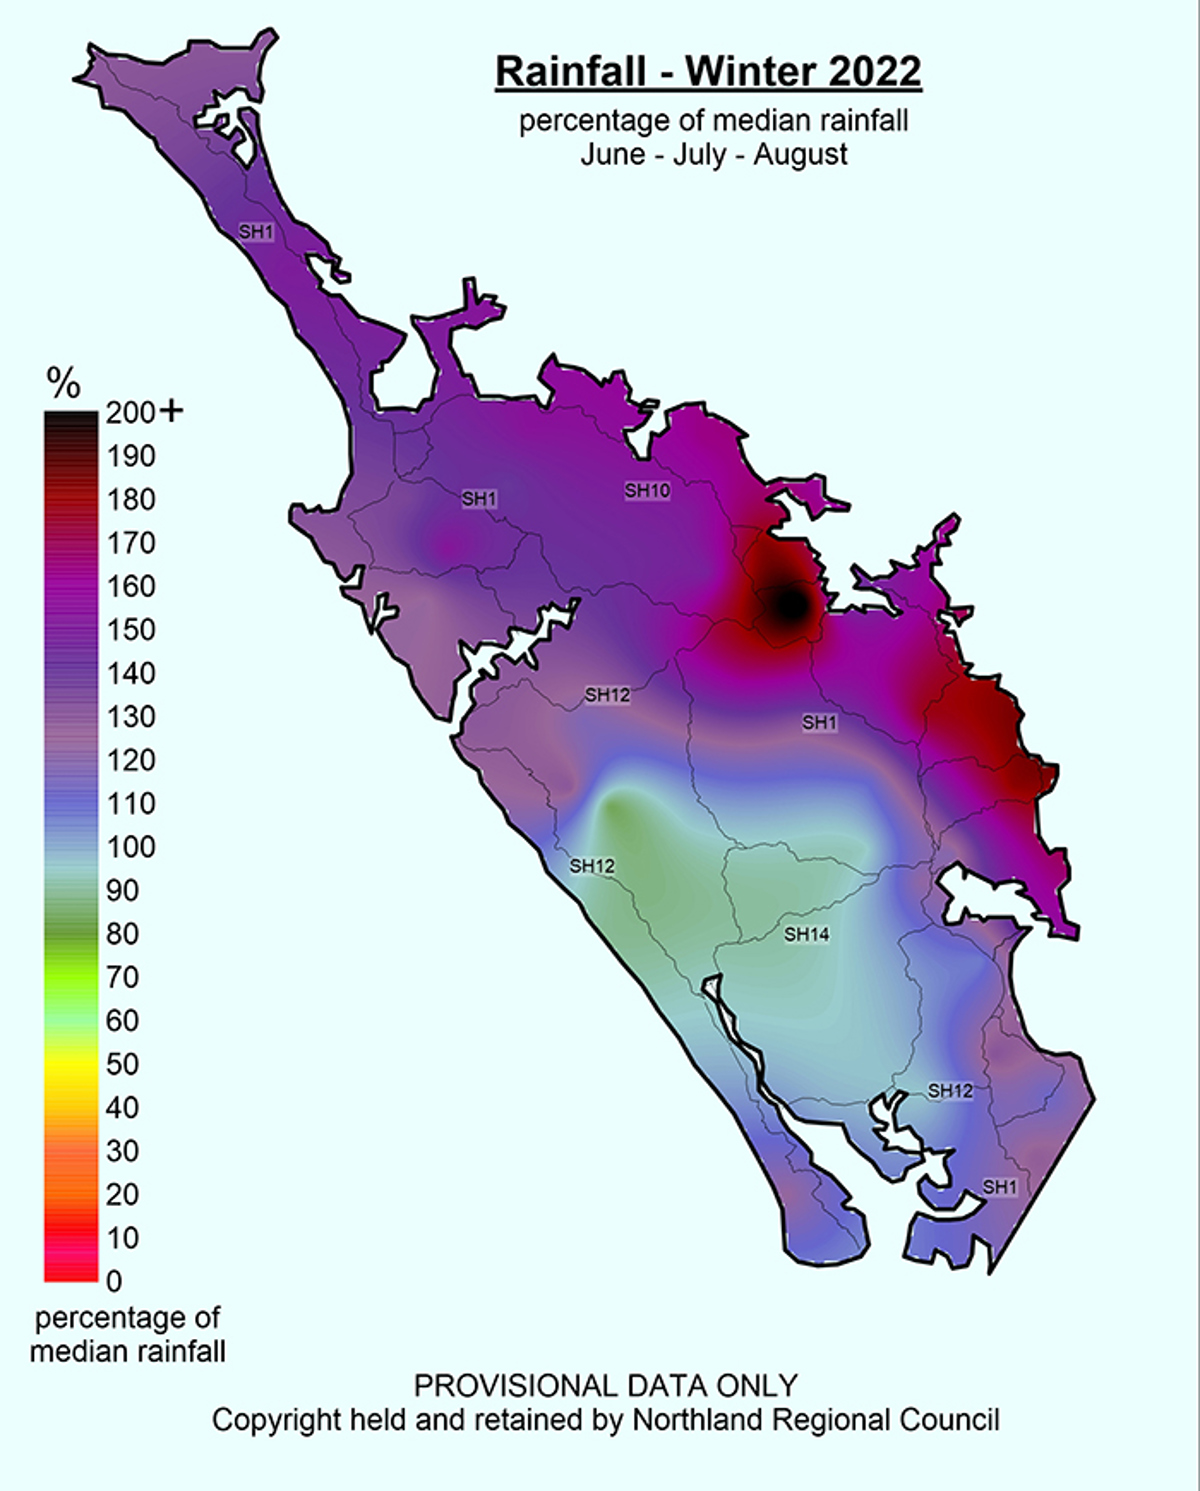
 Winter 2022 Median Rainfall Percentage
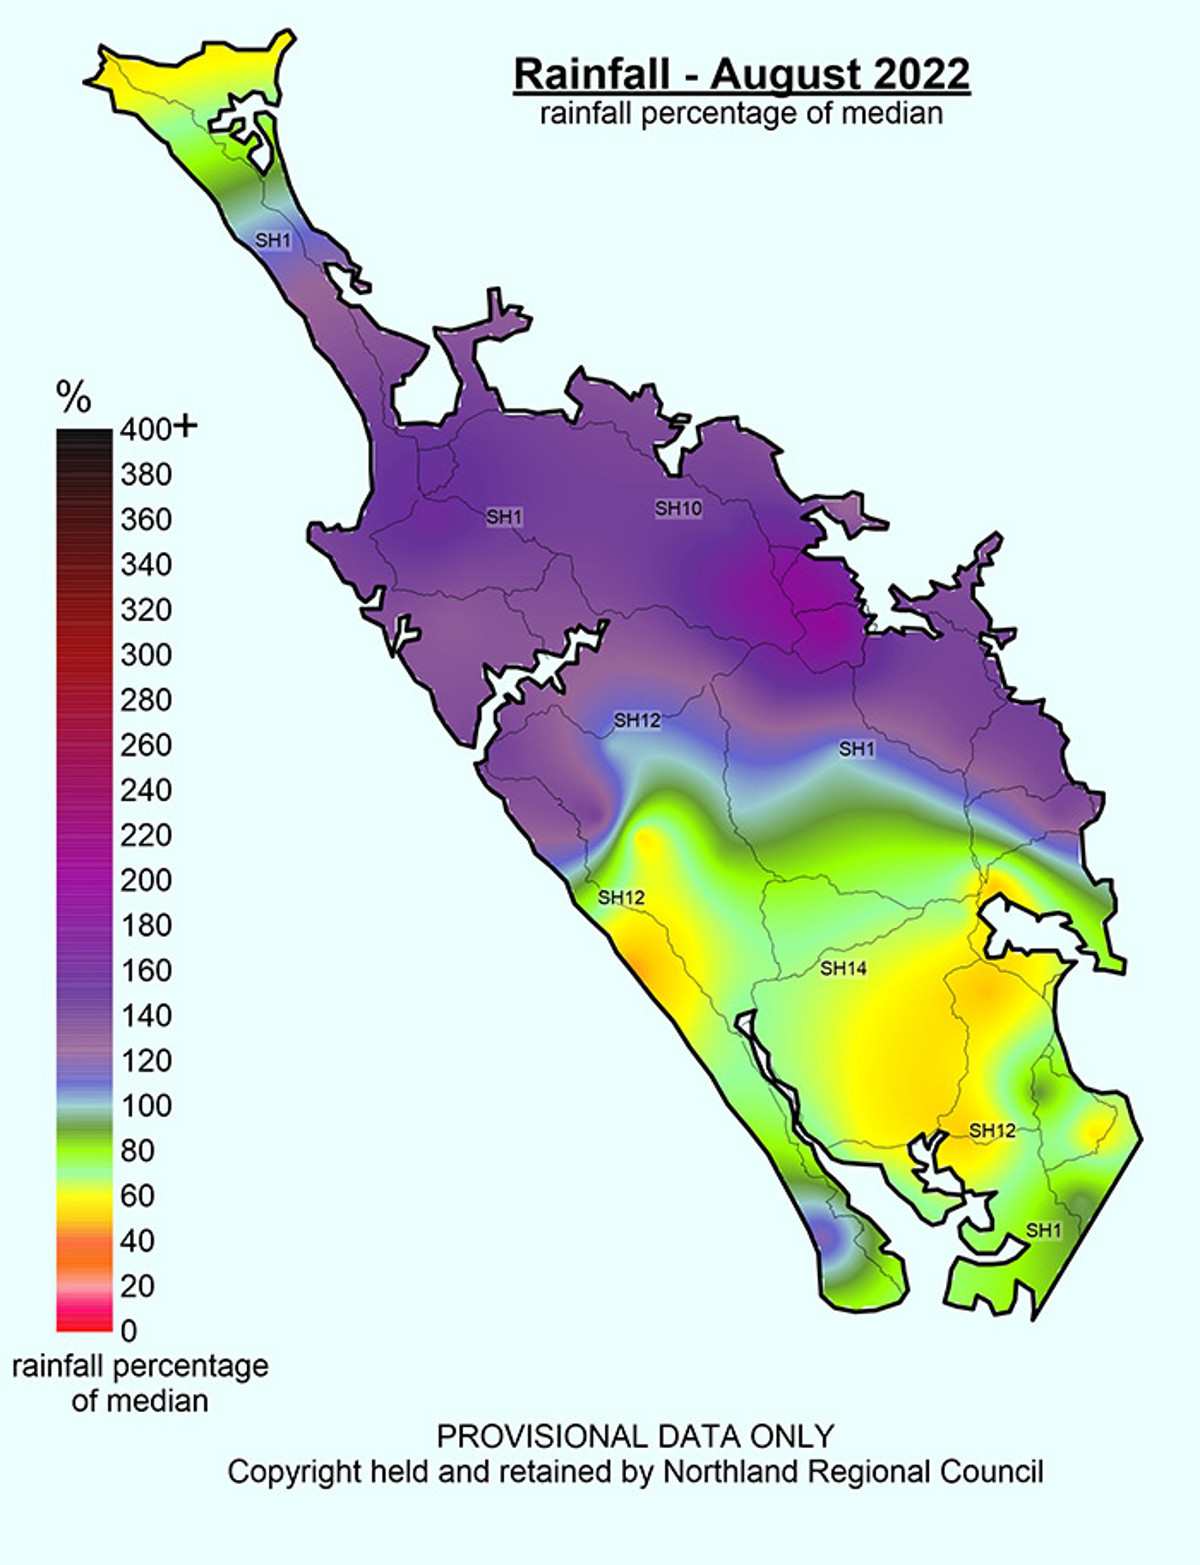
 August 2022 Rainfall Median Percentages
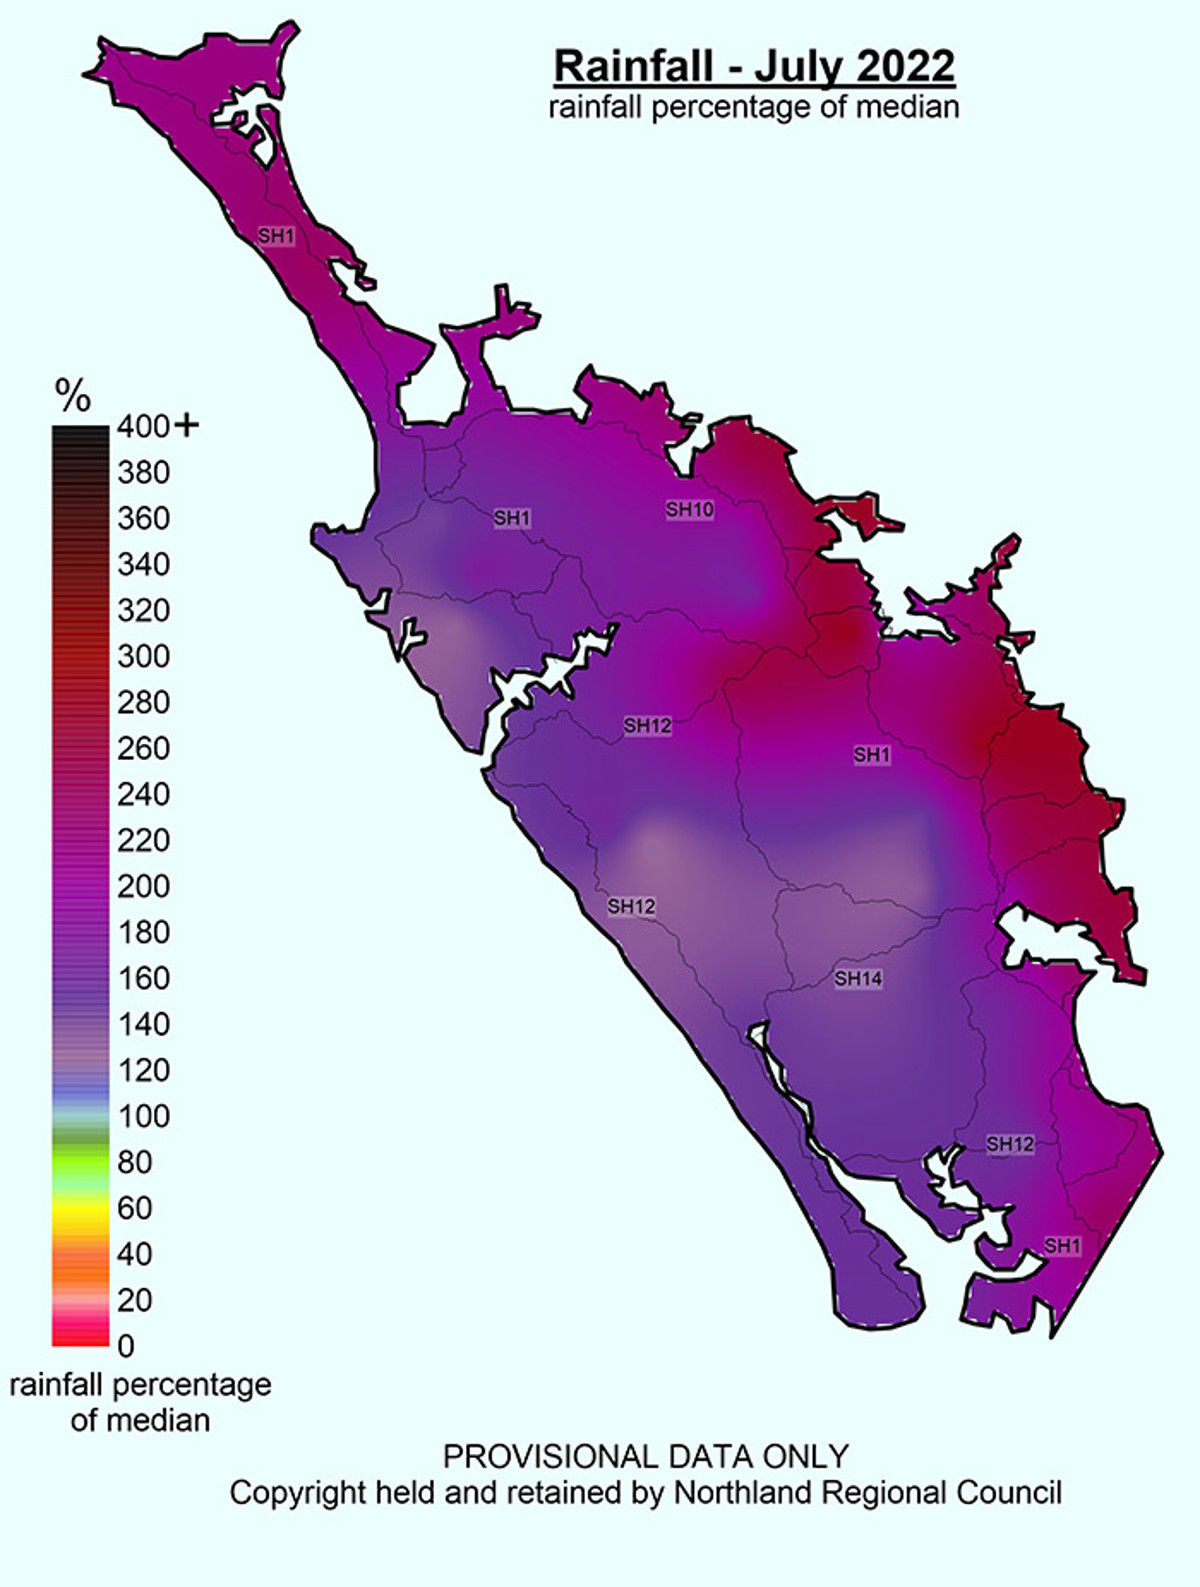
 July 2022 Rainfall Median Percentage
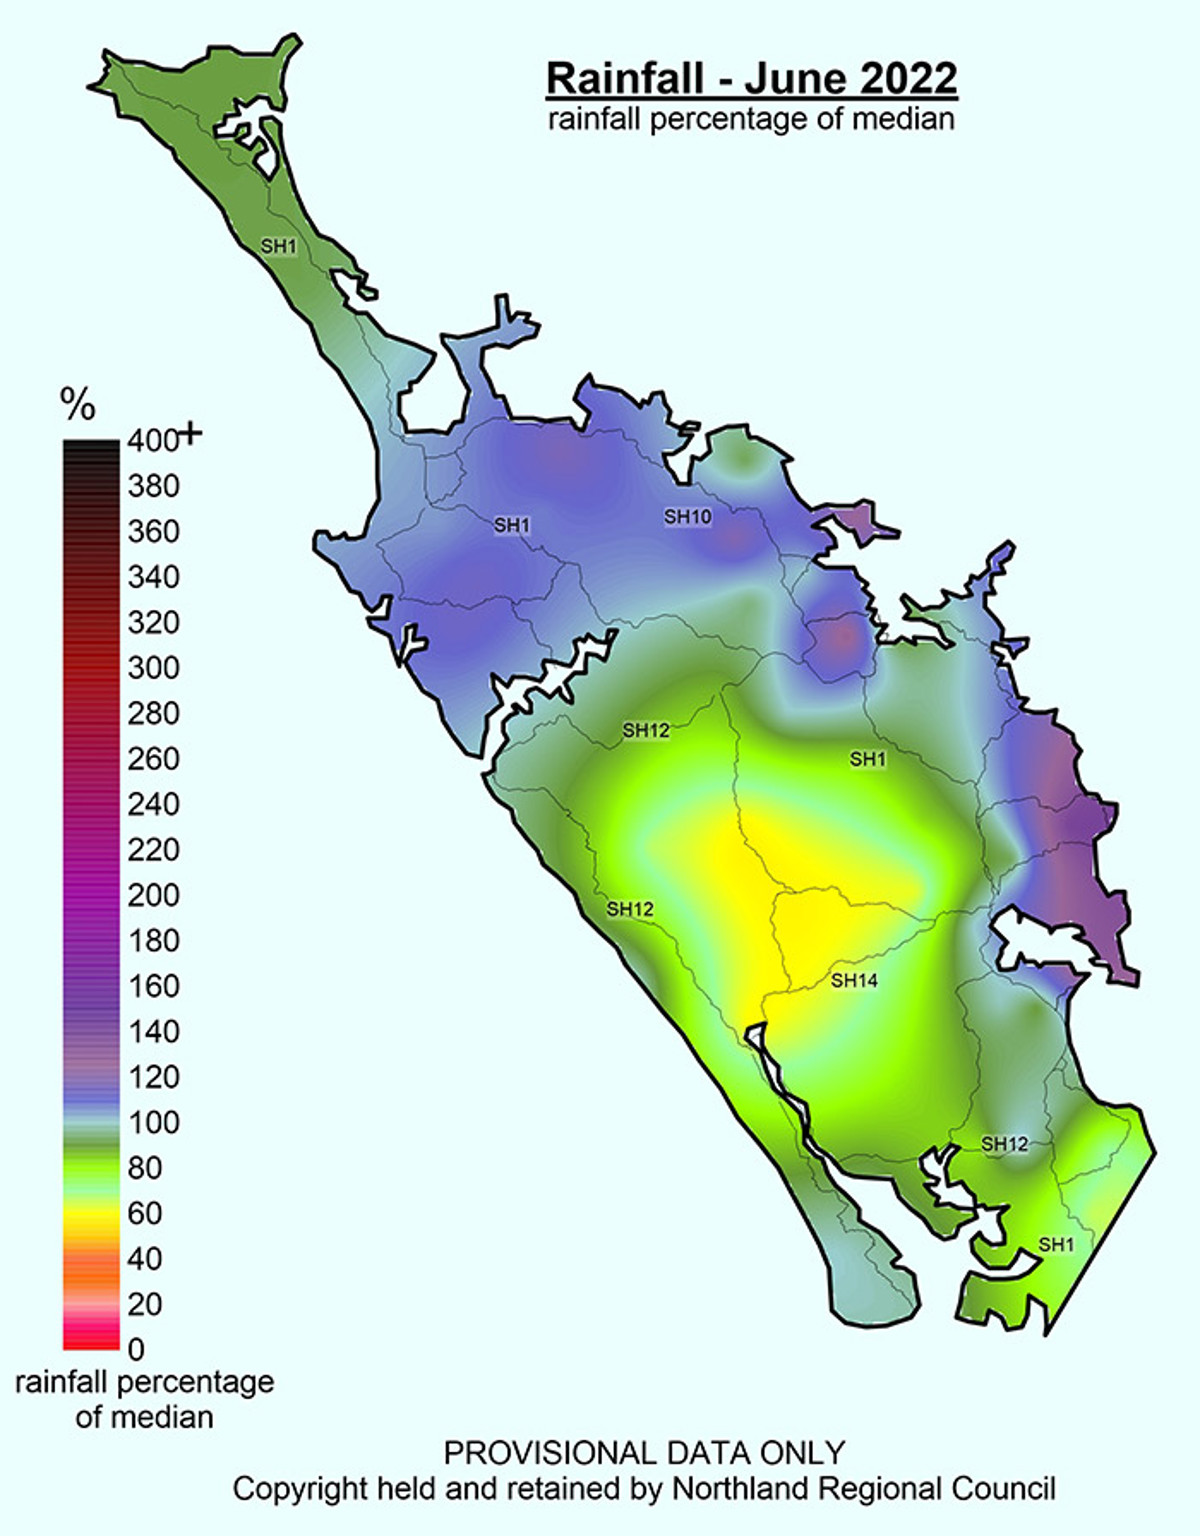
 June 2022 Rainfall Median Percentage
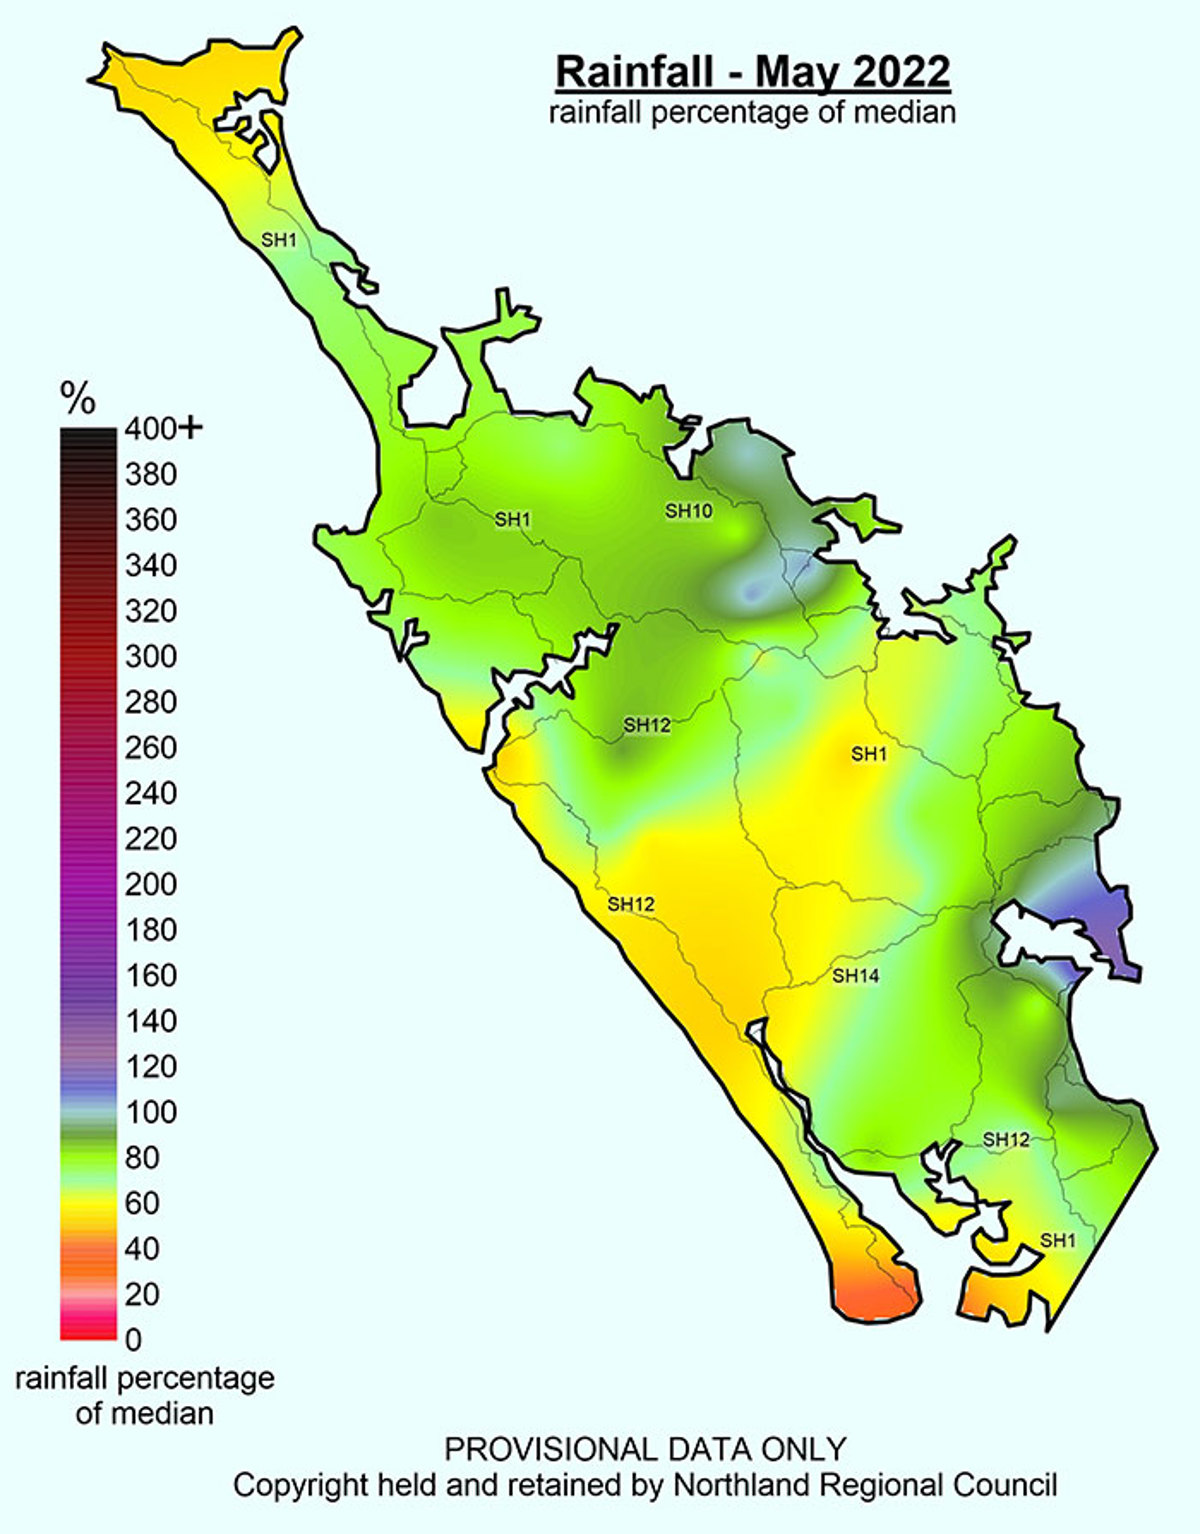
 May 2022 Rainfall Median Percentages
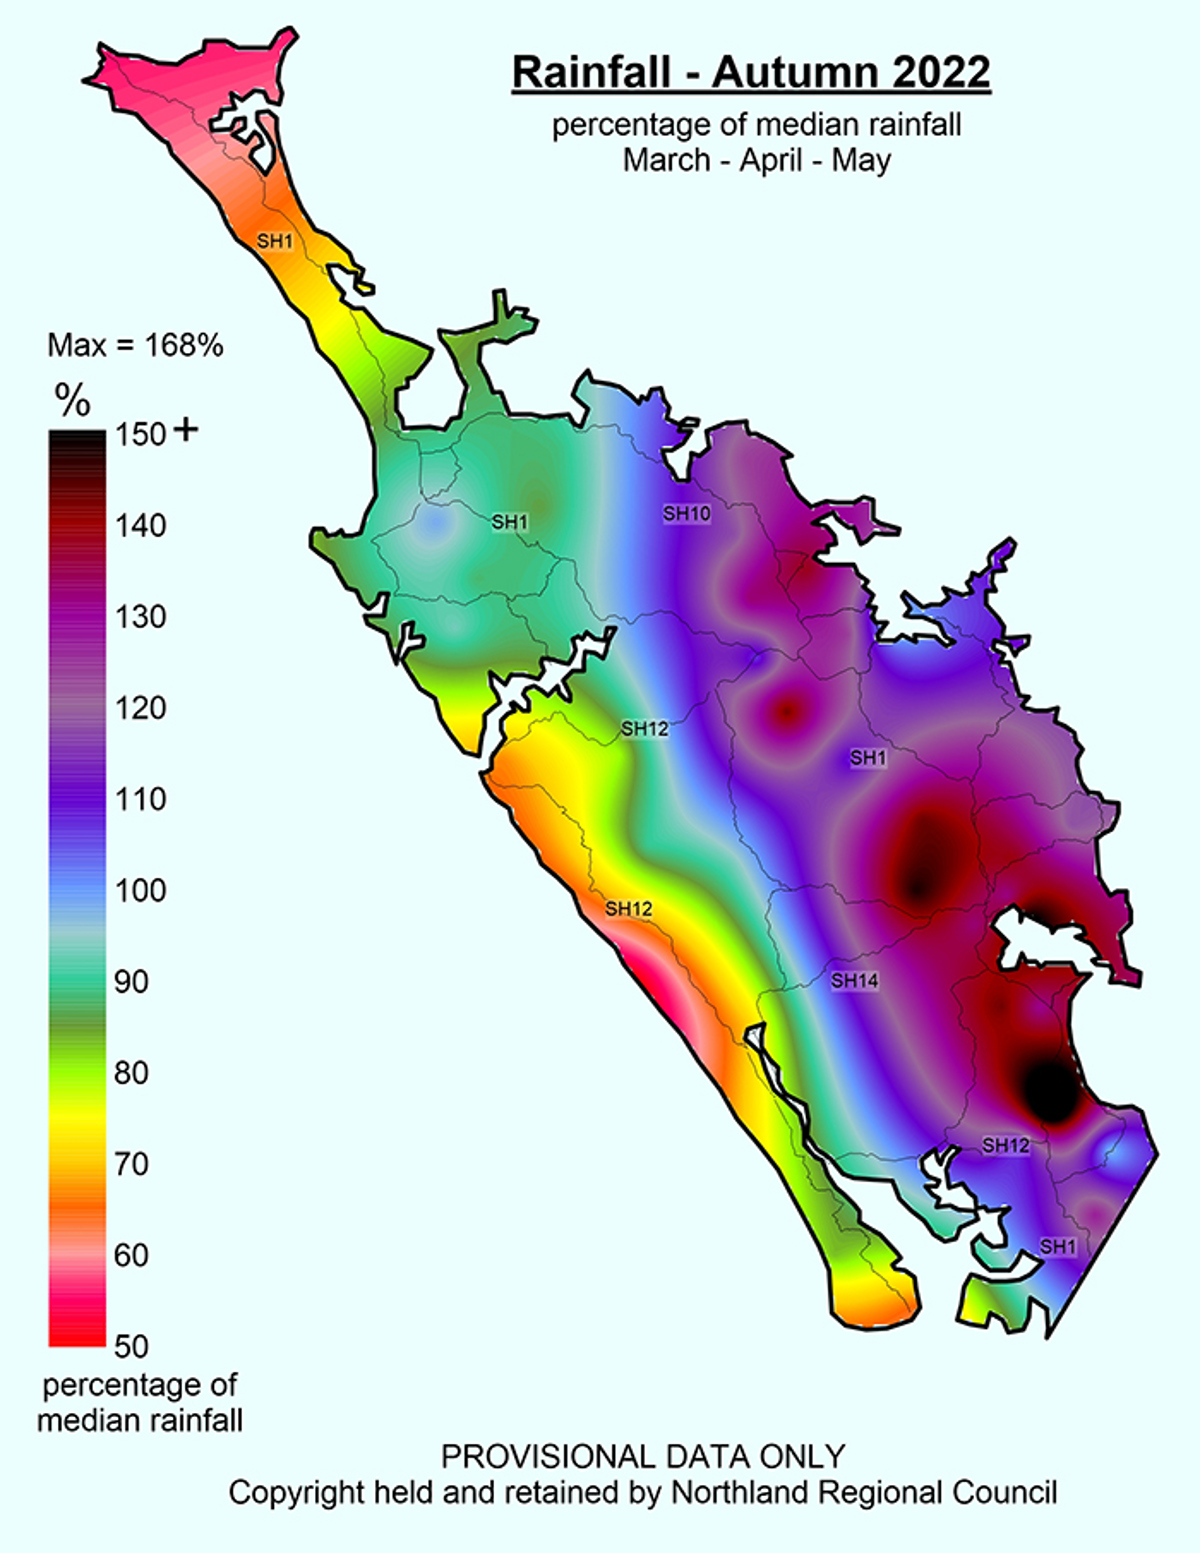
 Autumn 2022 Median Percentages
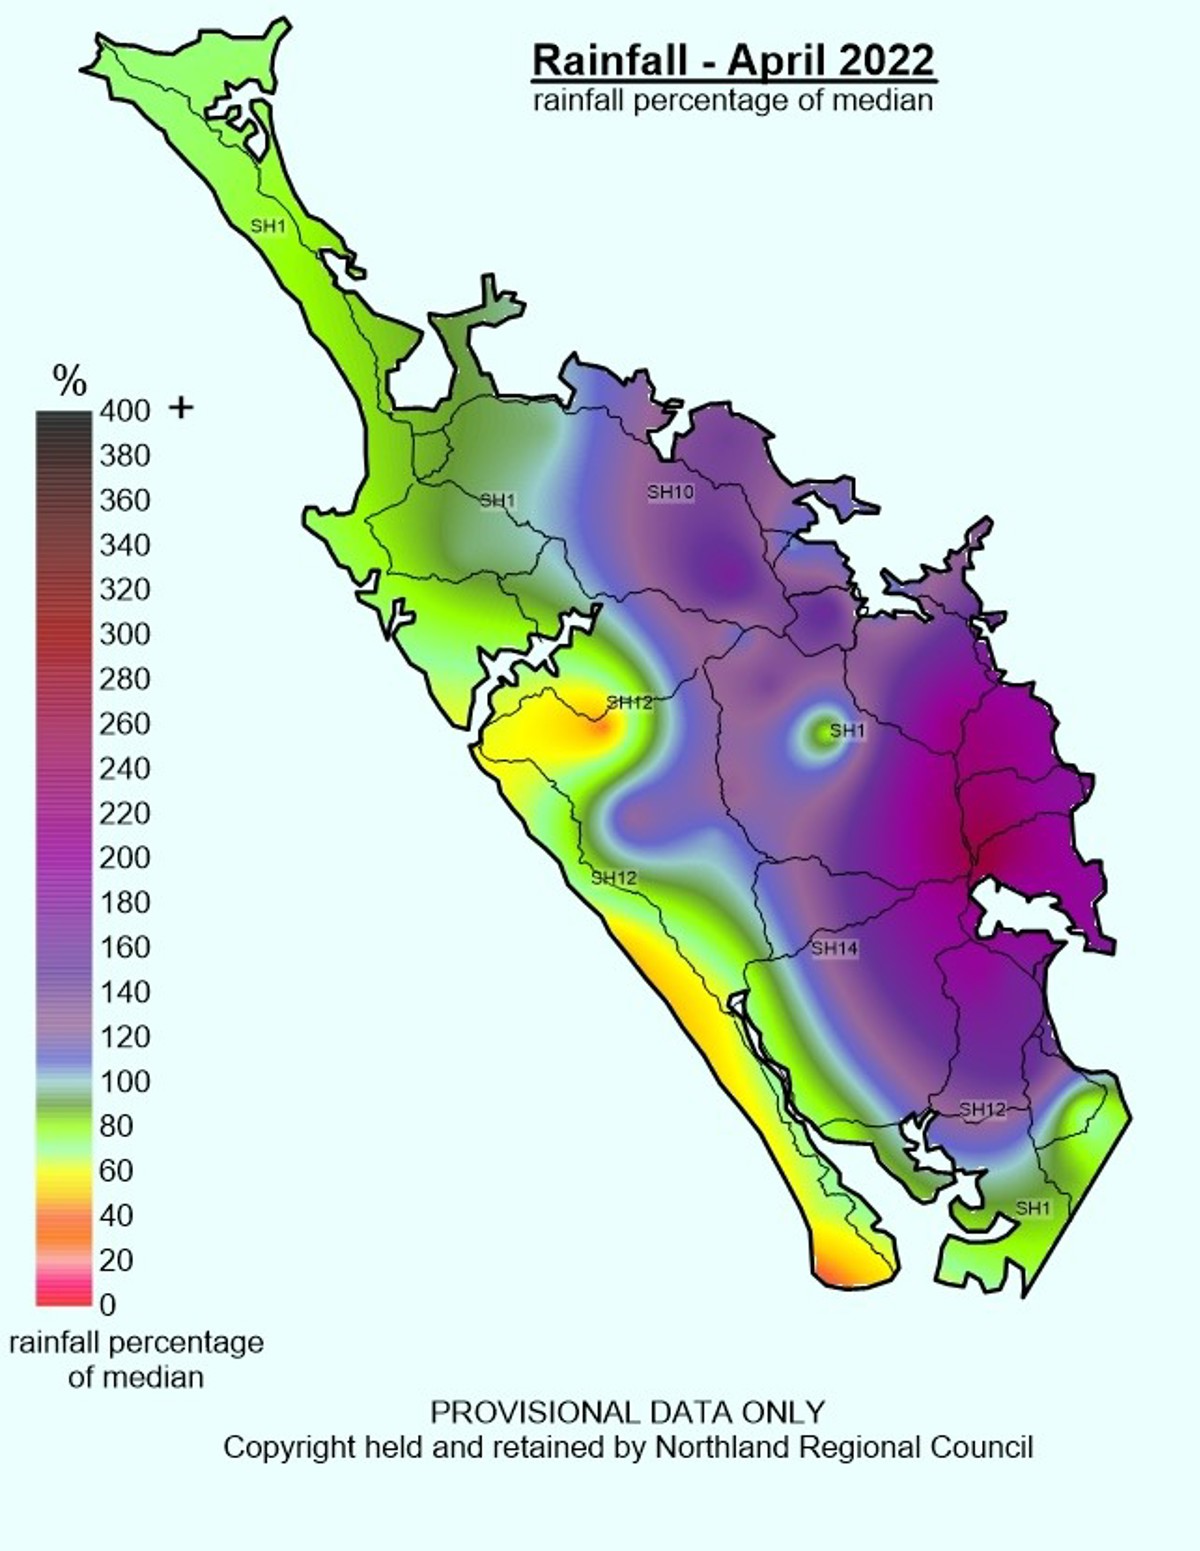
 April 2022 Rainfall Percentage Of Median
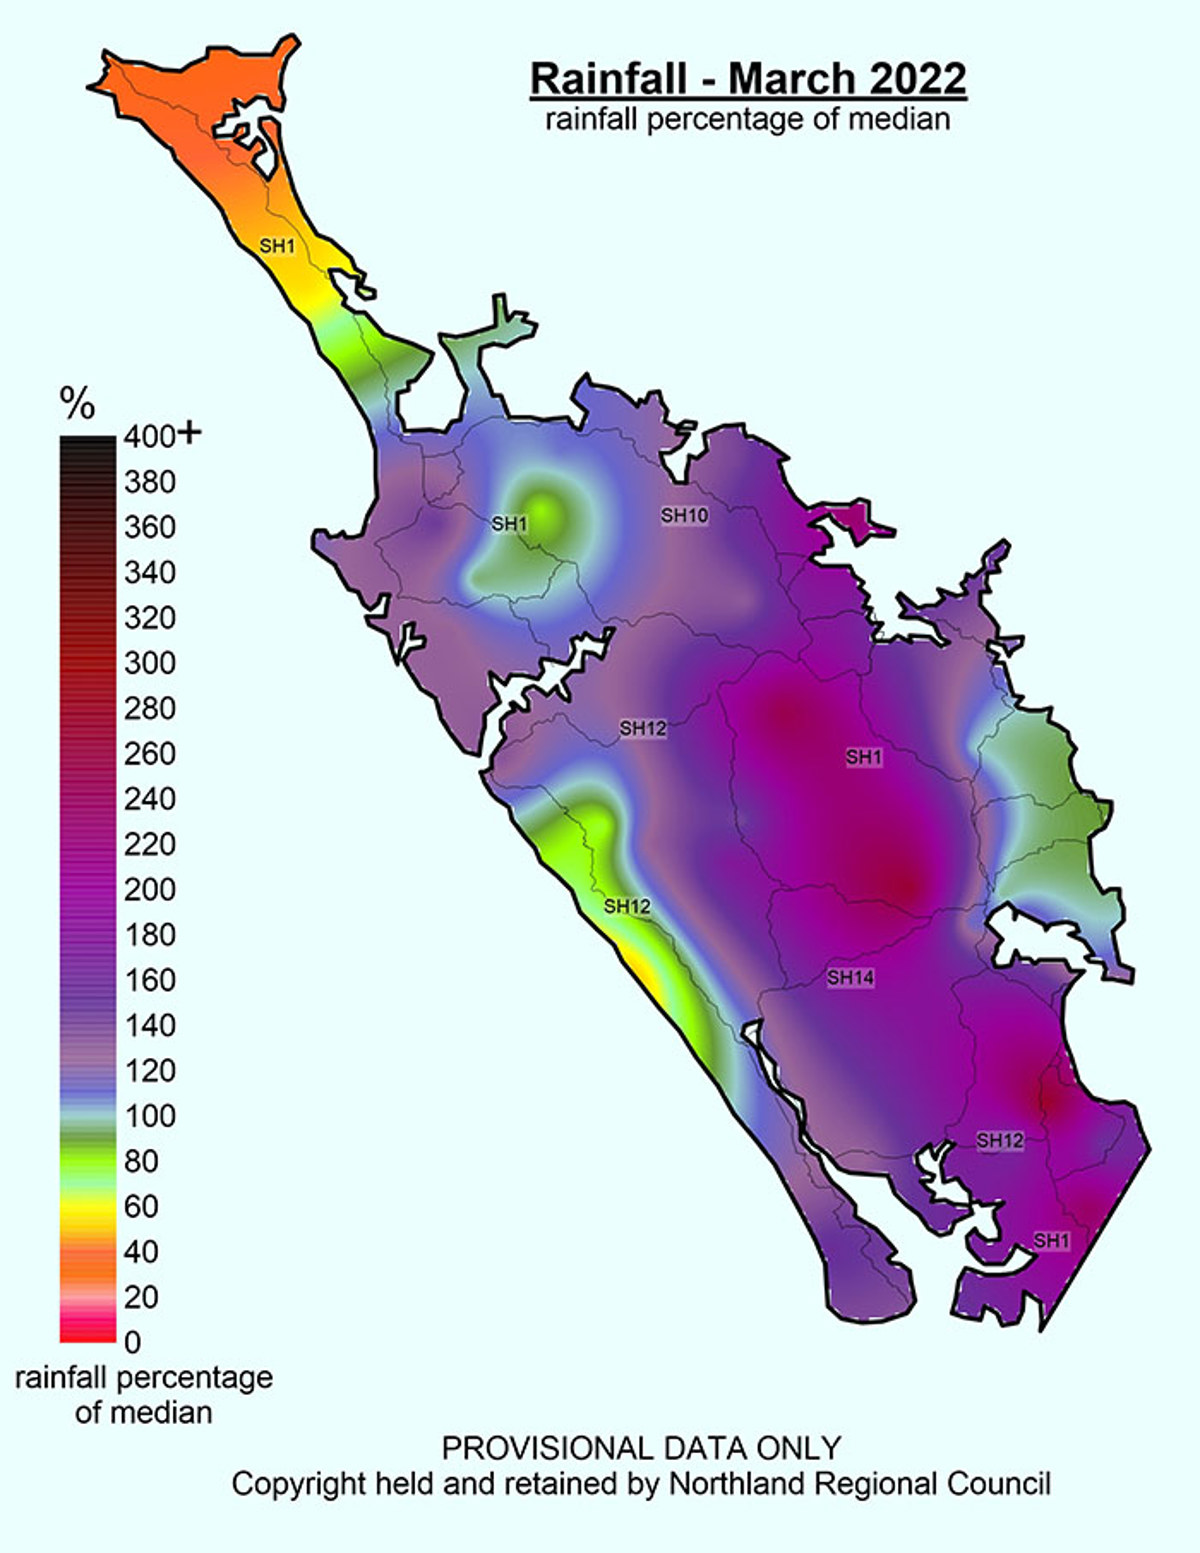
 March 2022 Rainfall Percentage Of Median
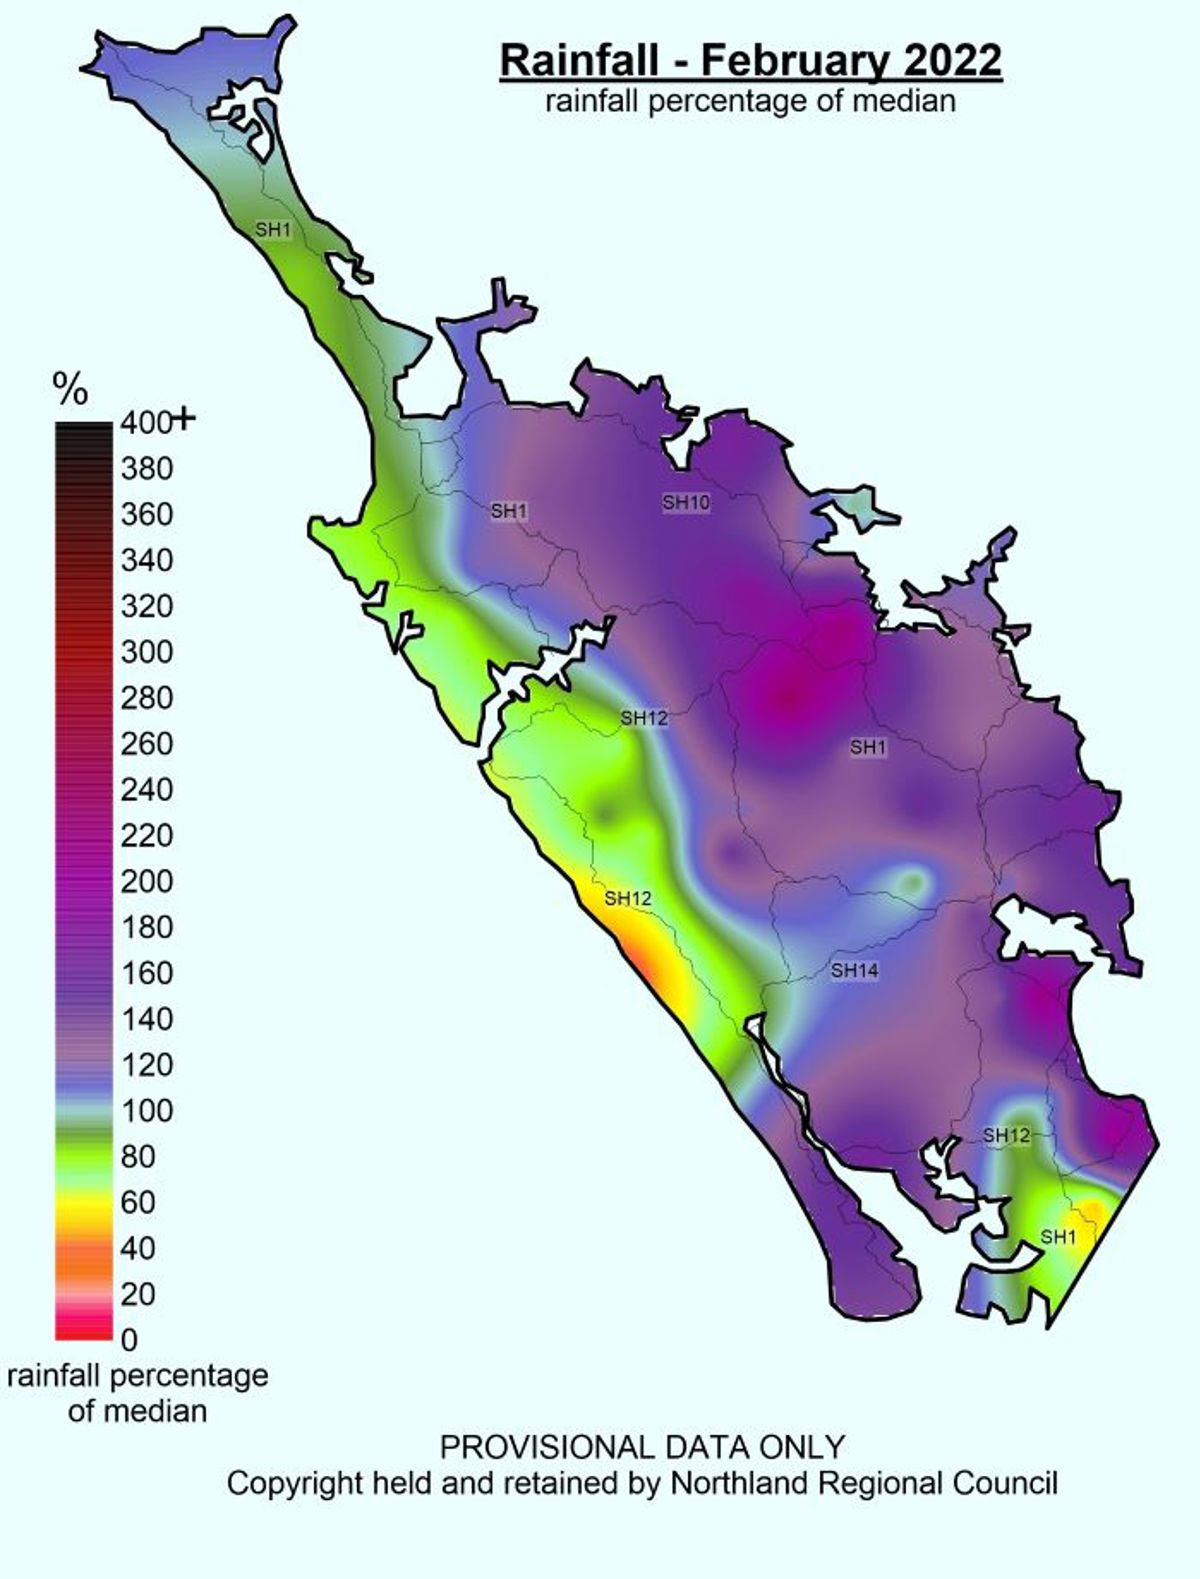
 February 2022 Rainfall Percentage Of Median
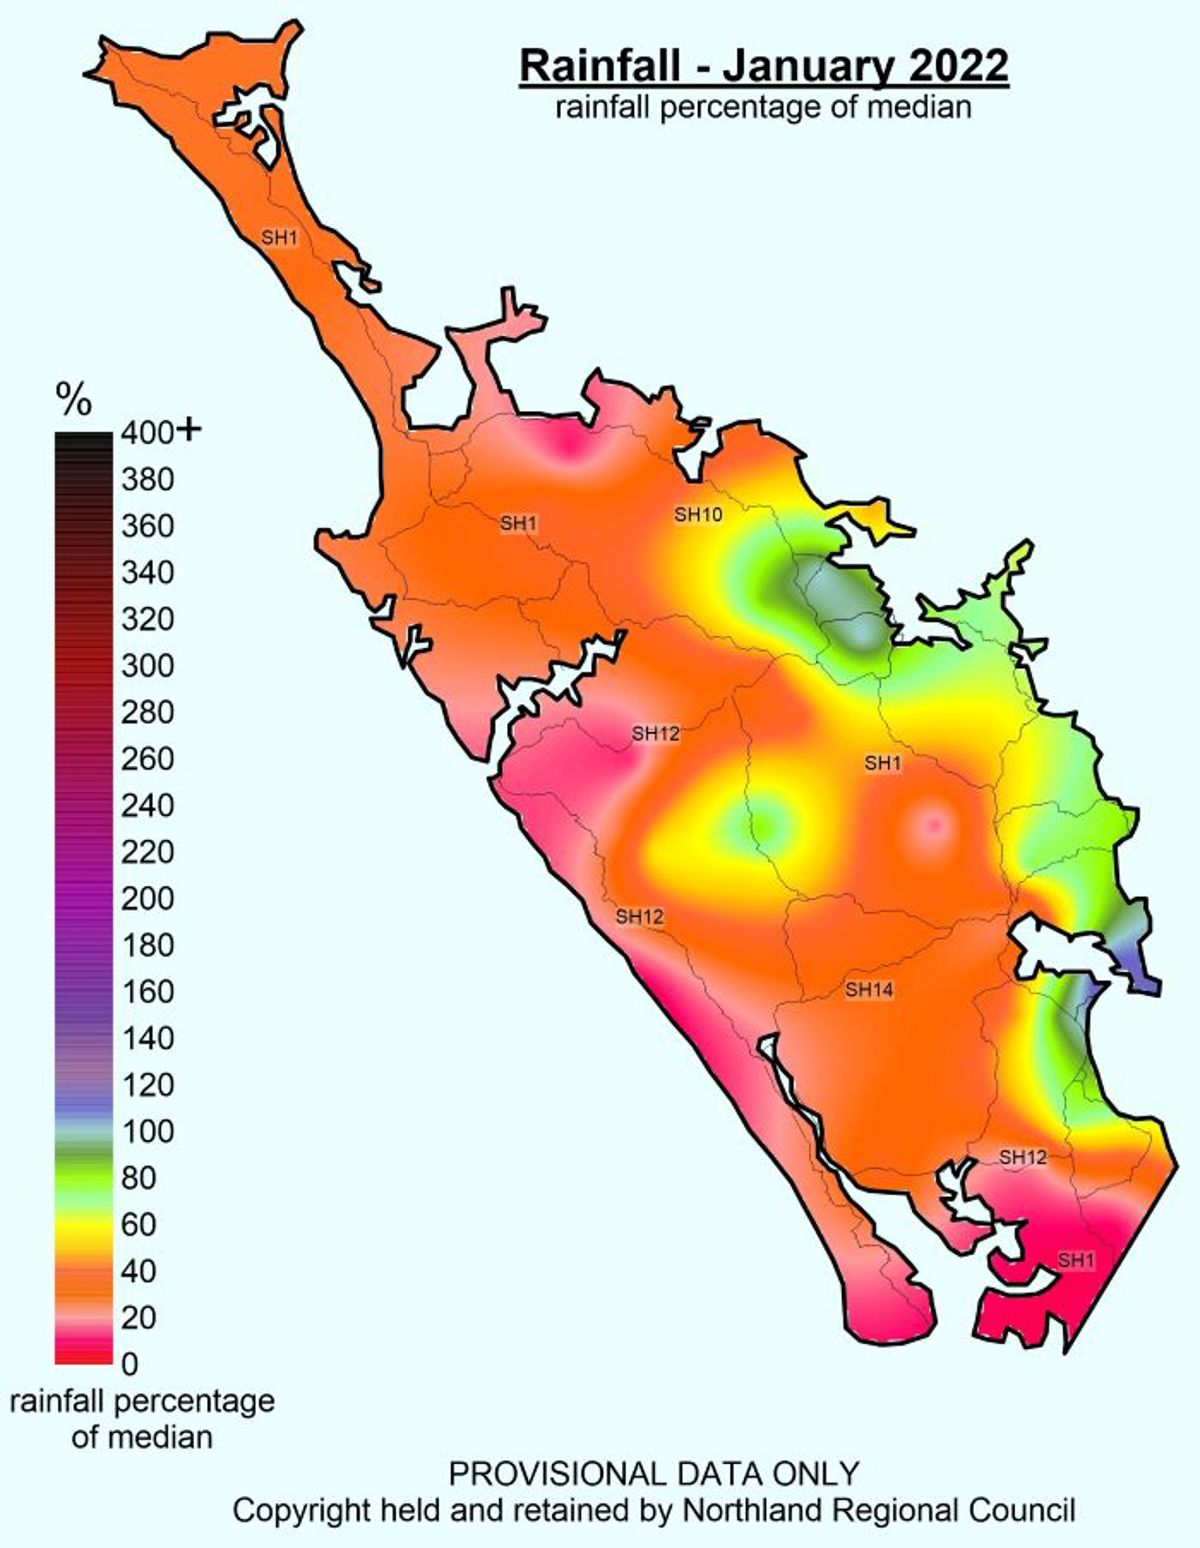
 January 2022 Rainfall Median Percentage
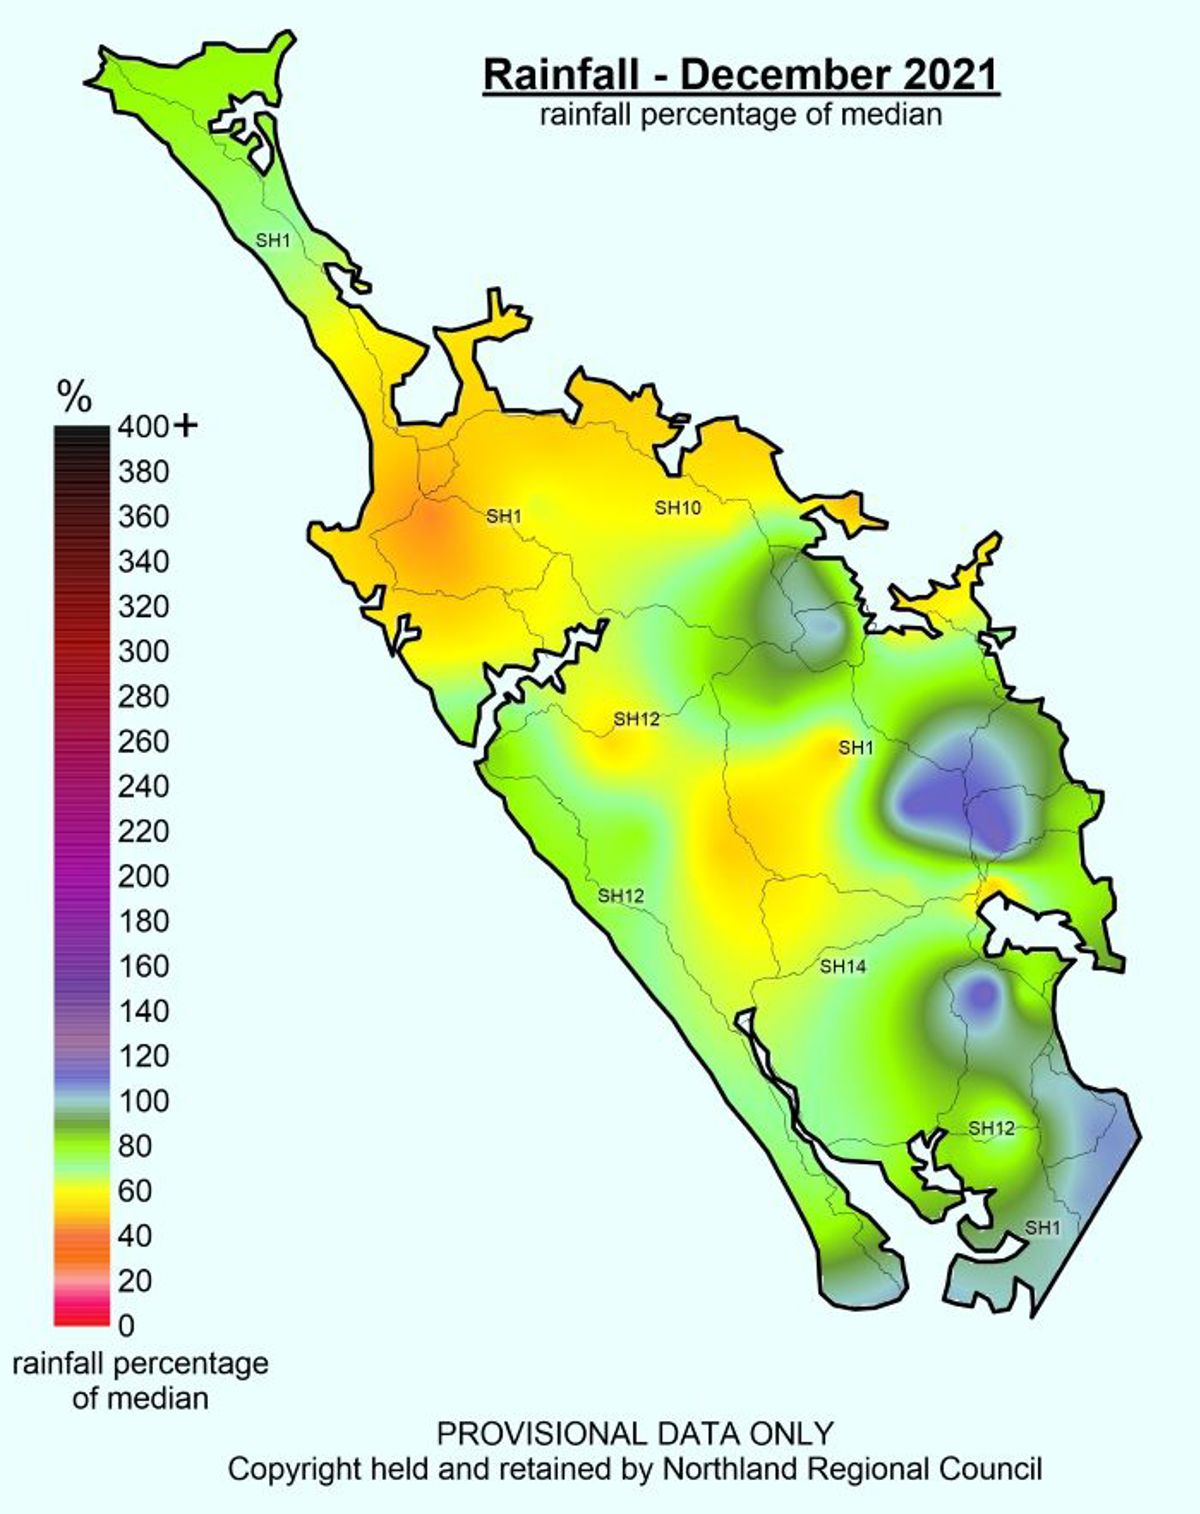
 December 2021 Rainfall Percentages Of Median
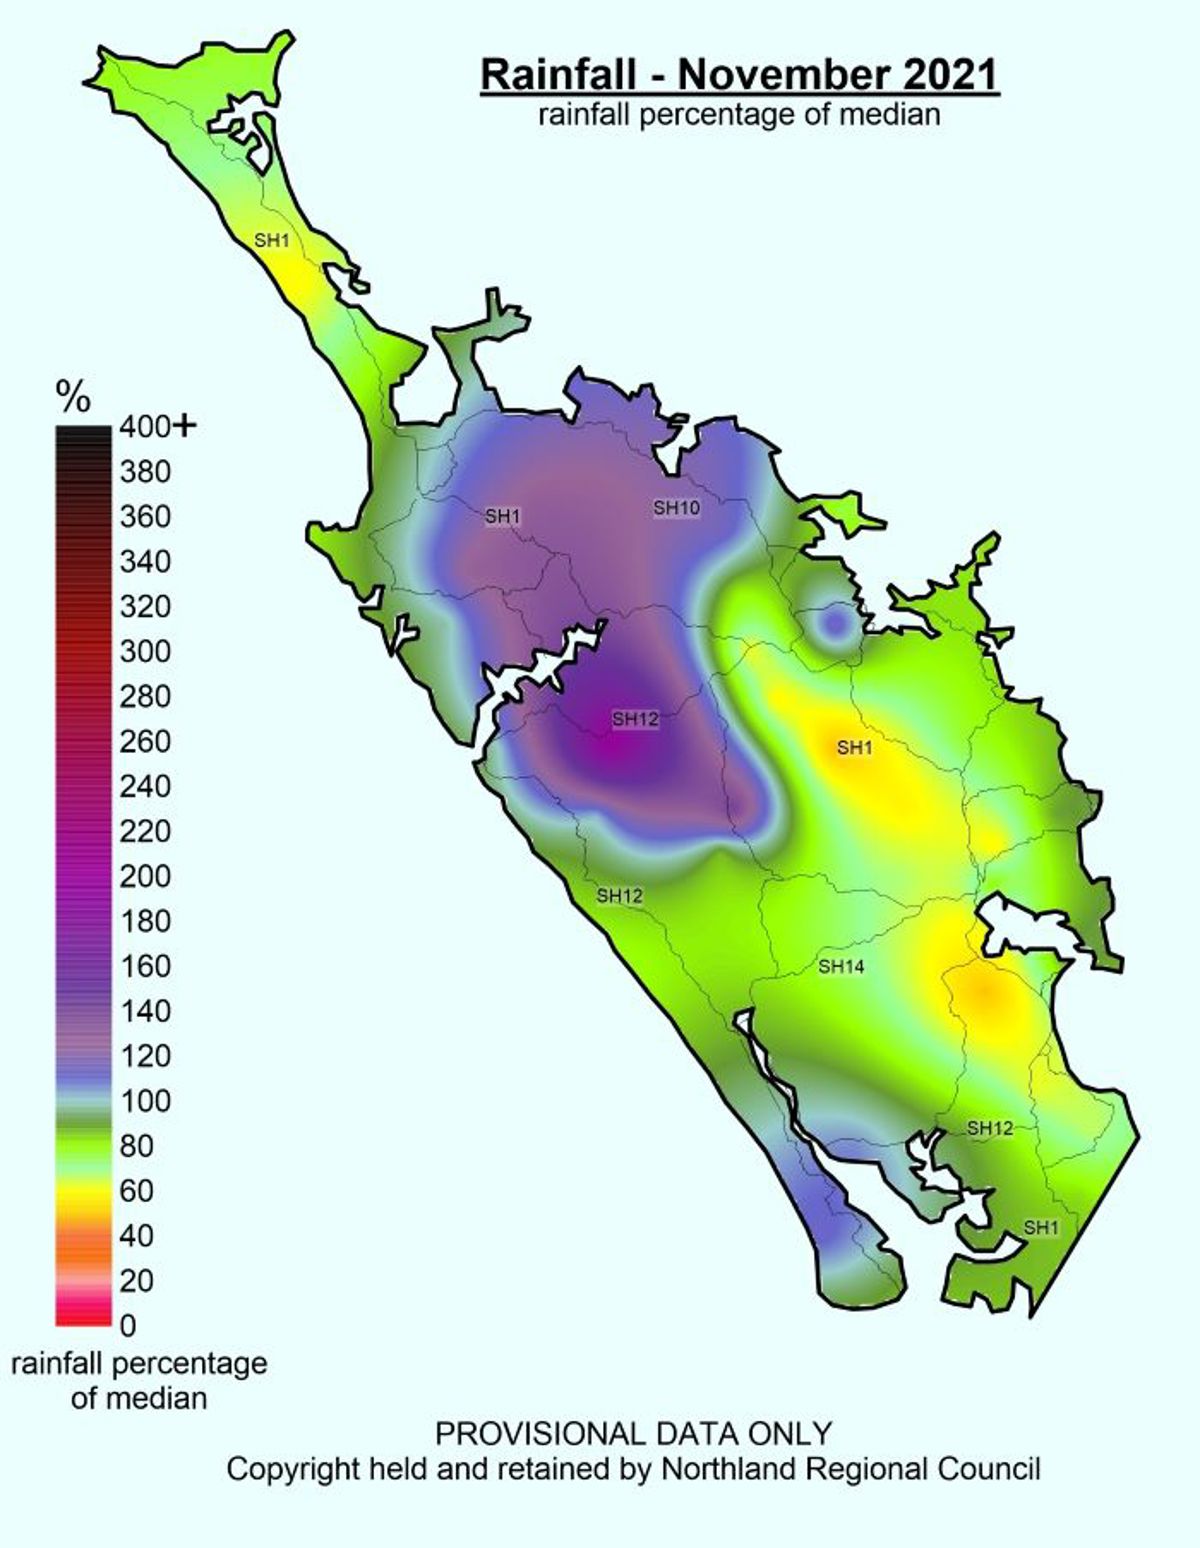
 November 2021 Rainfall Percentages Of Median
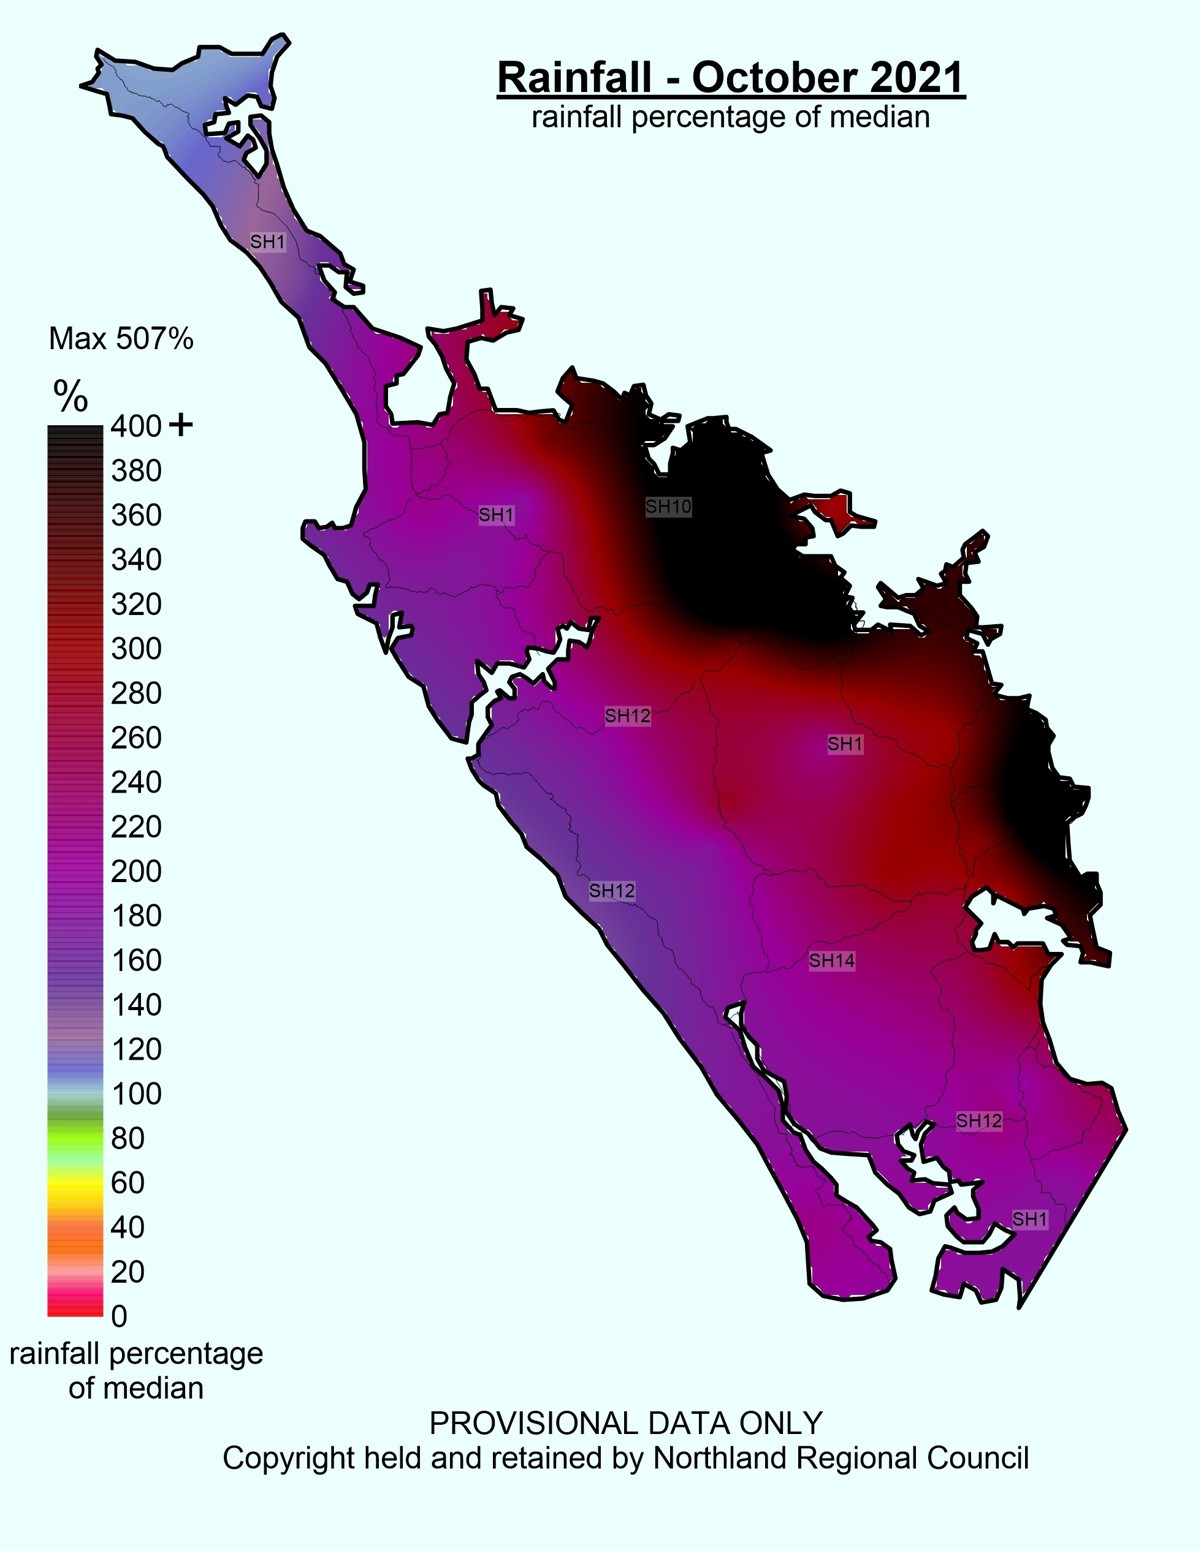
 October 2021 Rainfall Percentages Of Median
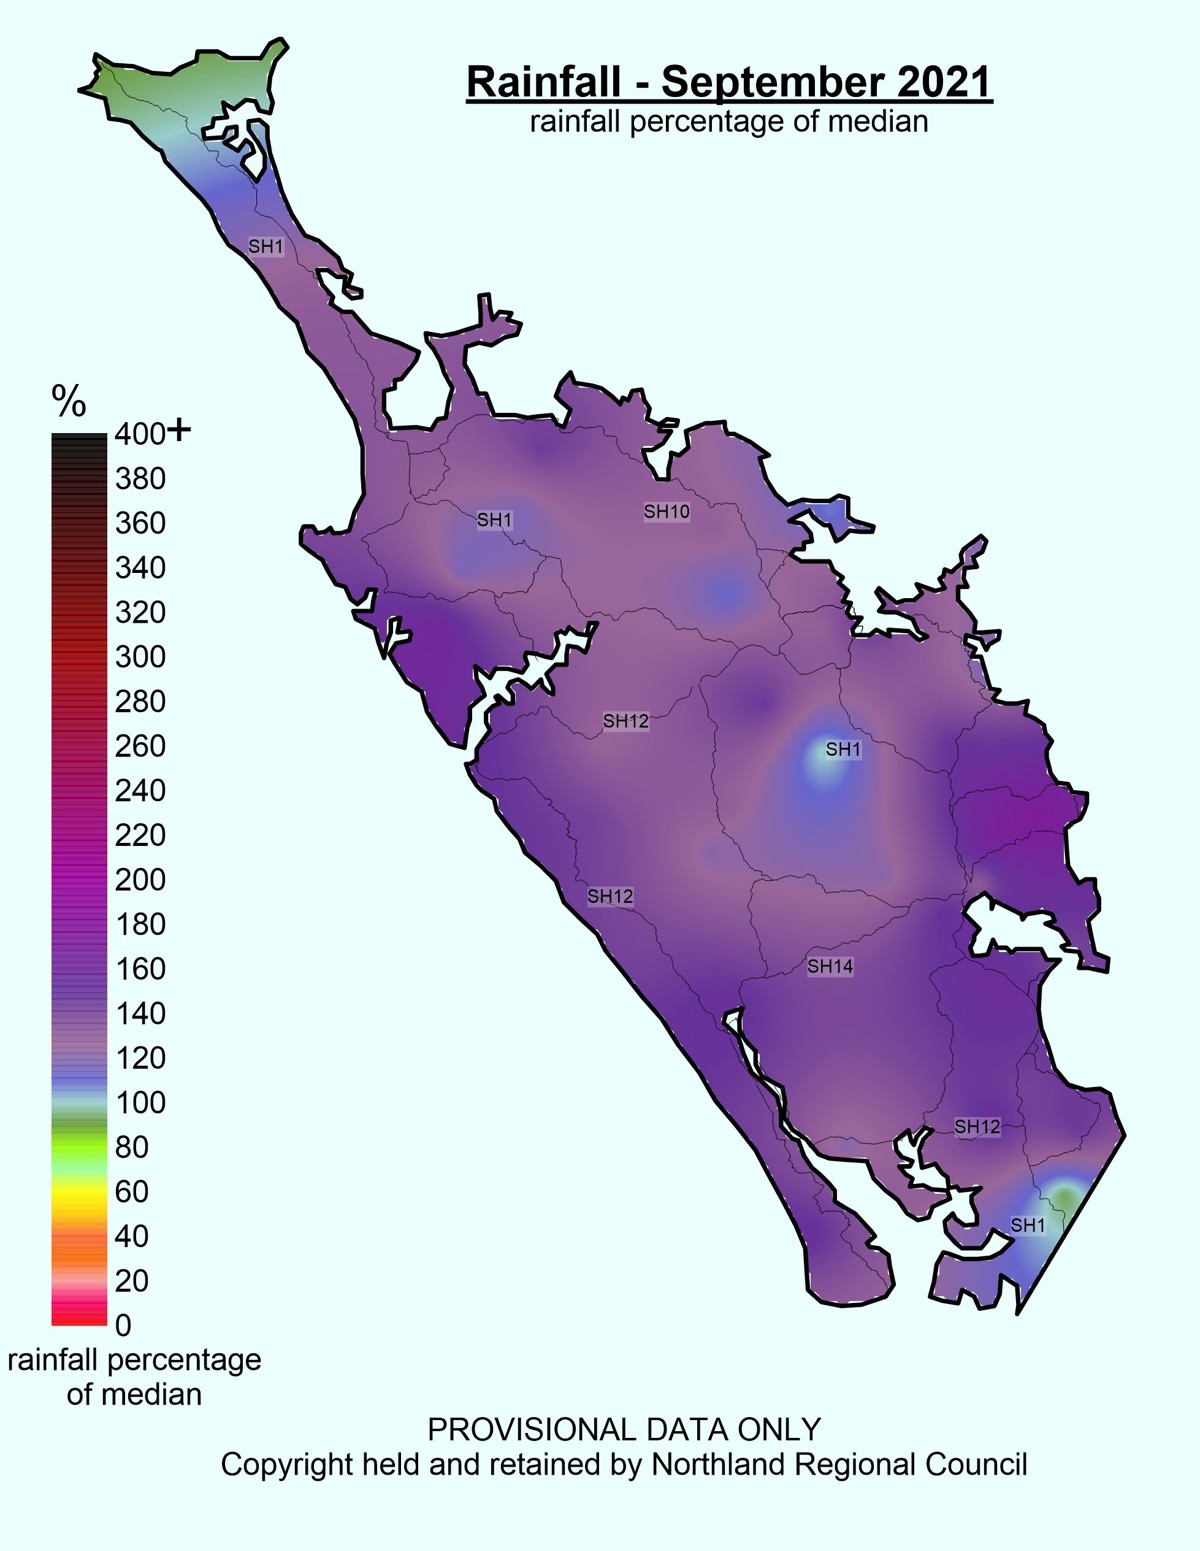
 September 2021 Median Rainfall Percentages
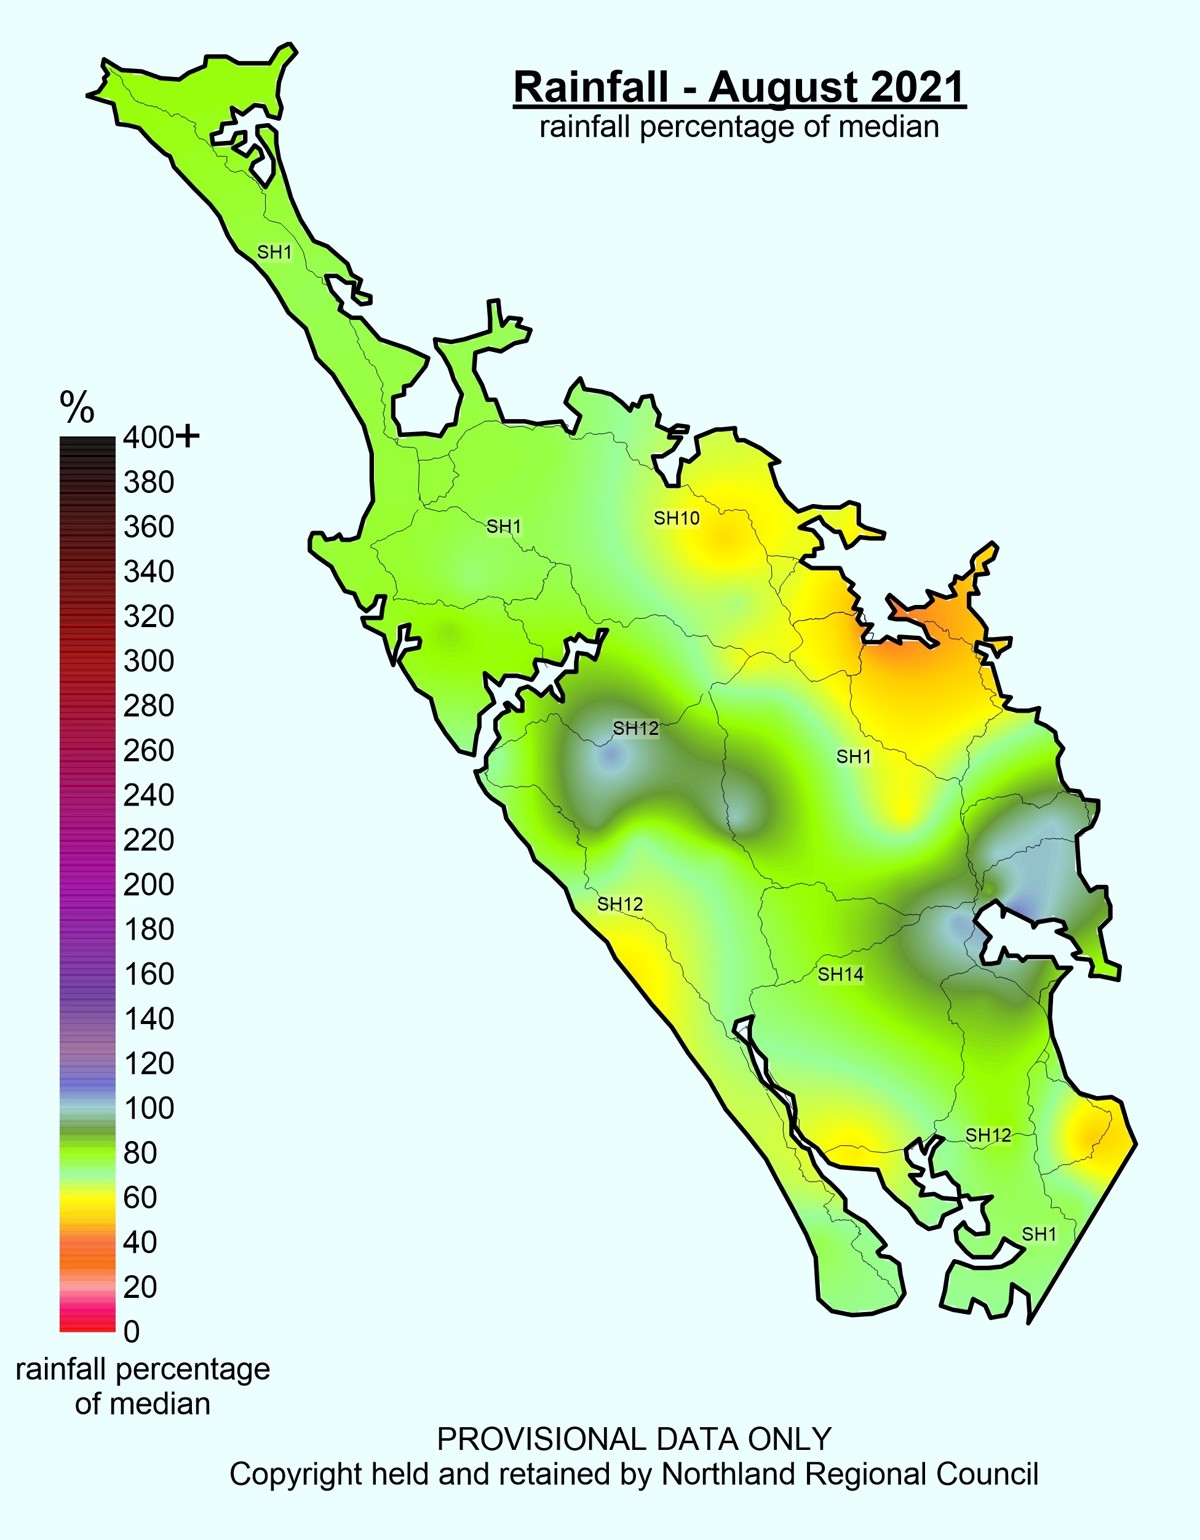
 August 2021 Median Rainfall Percentages
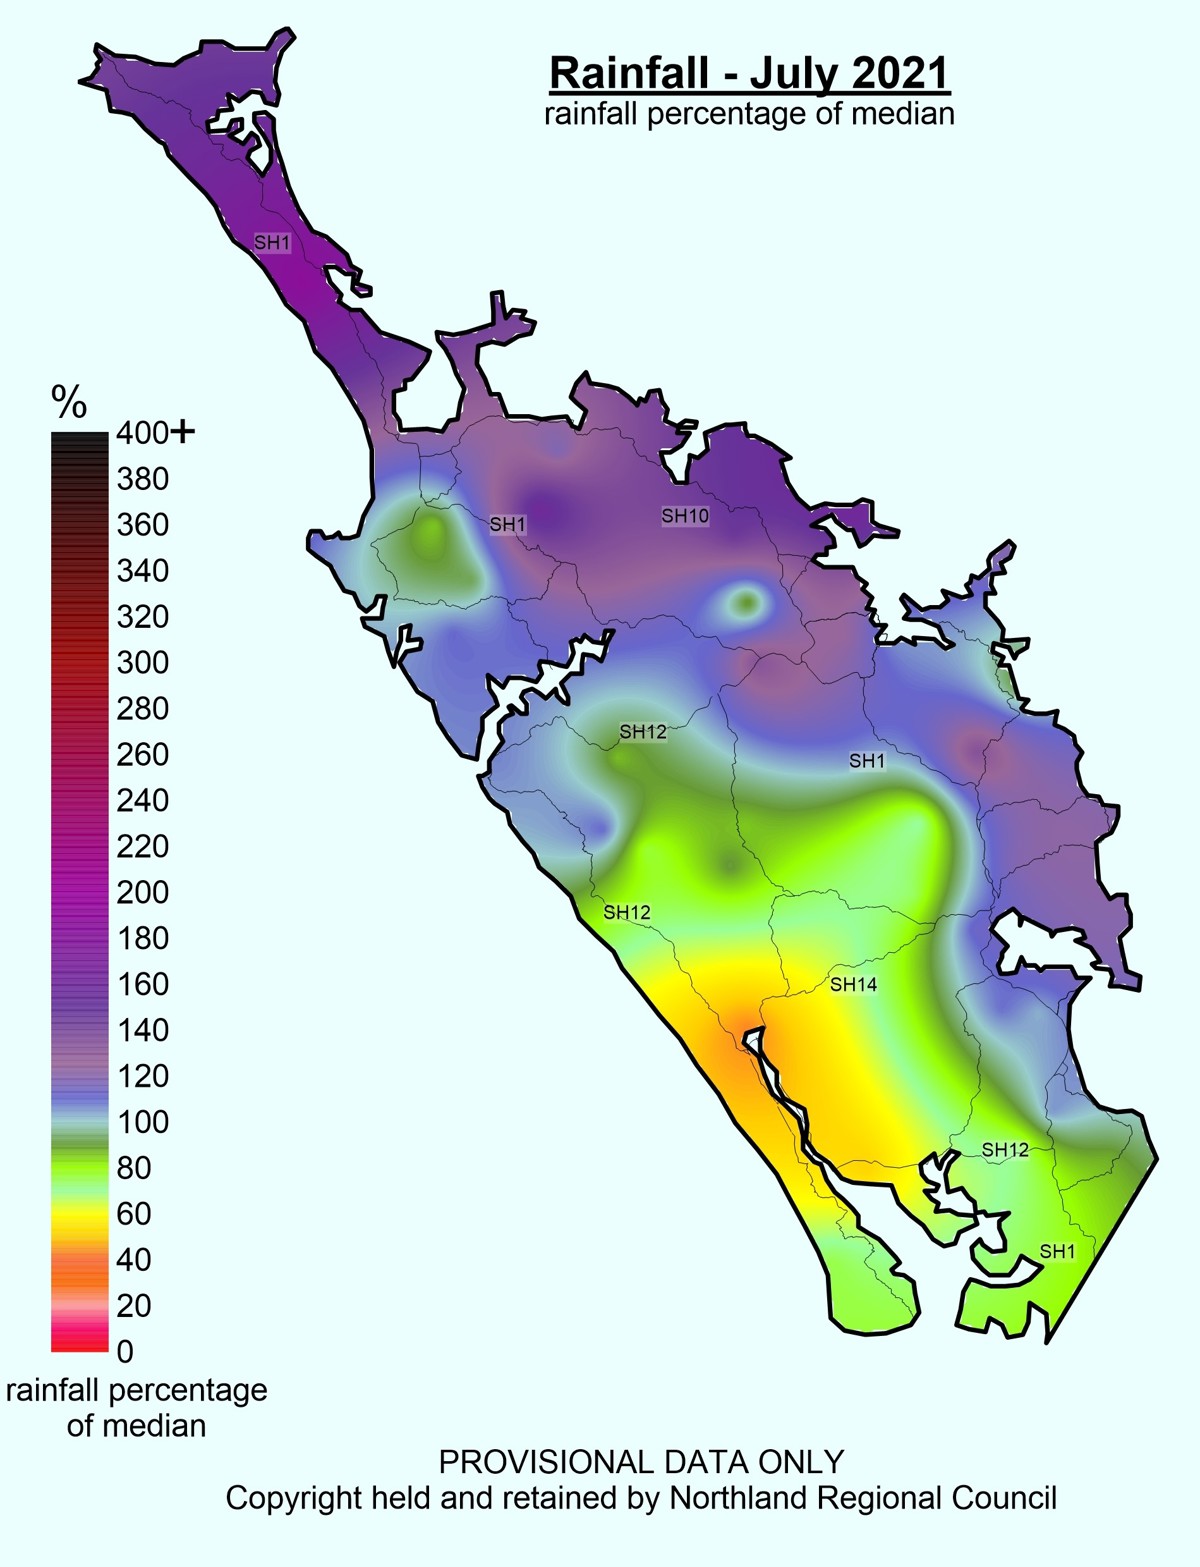
 July 2021 Rainfall Median Percentage
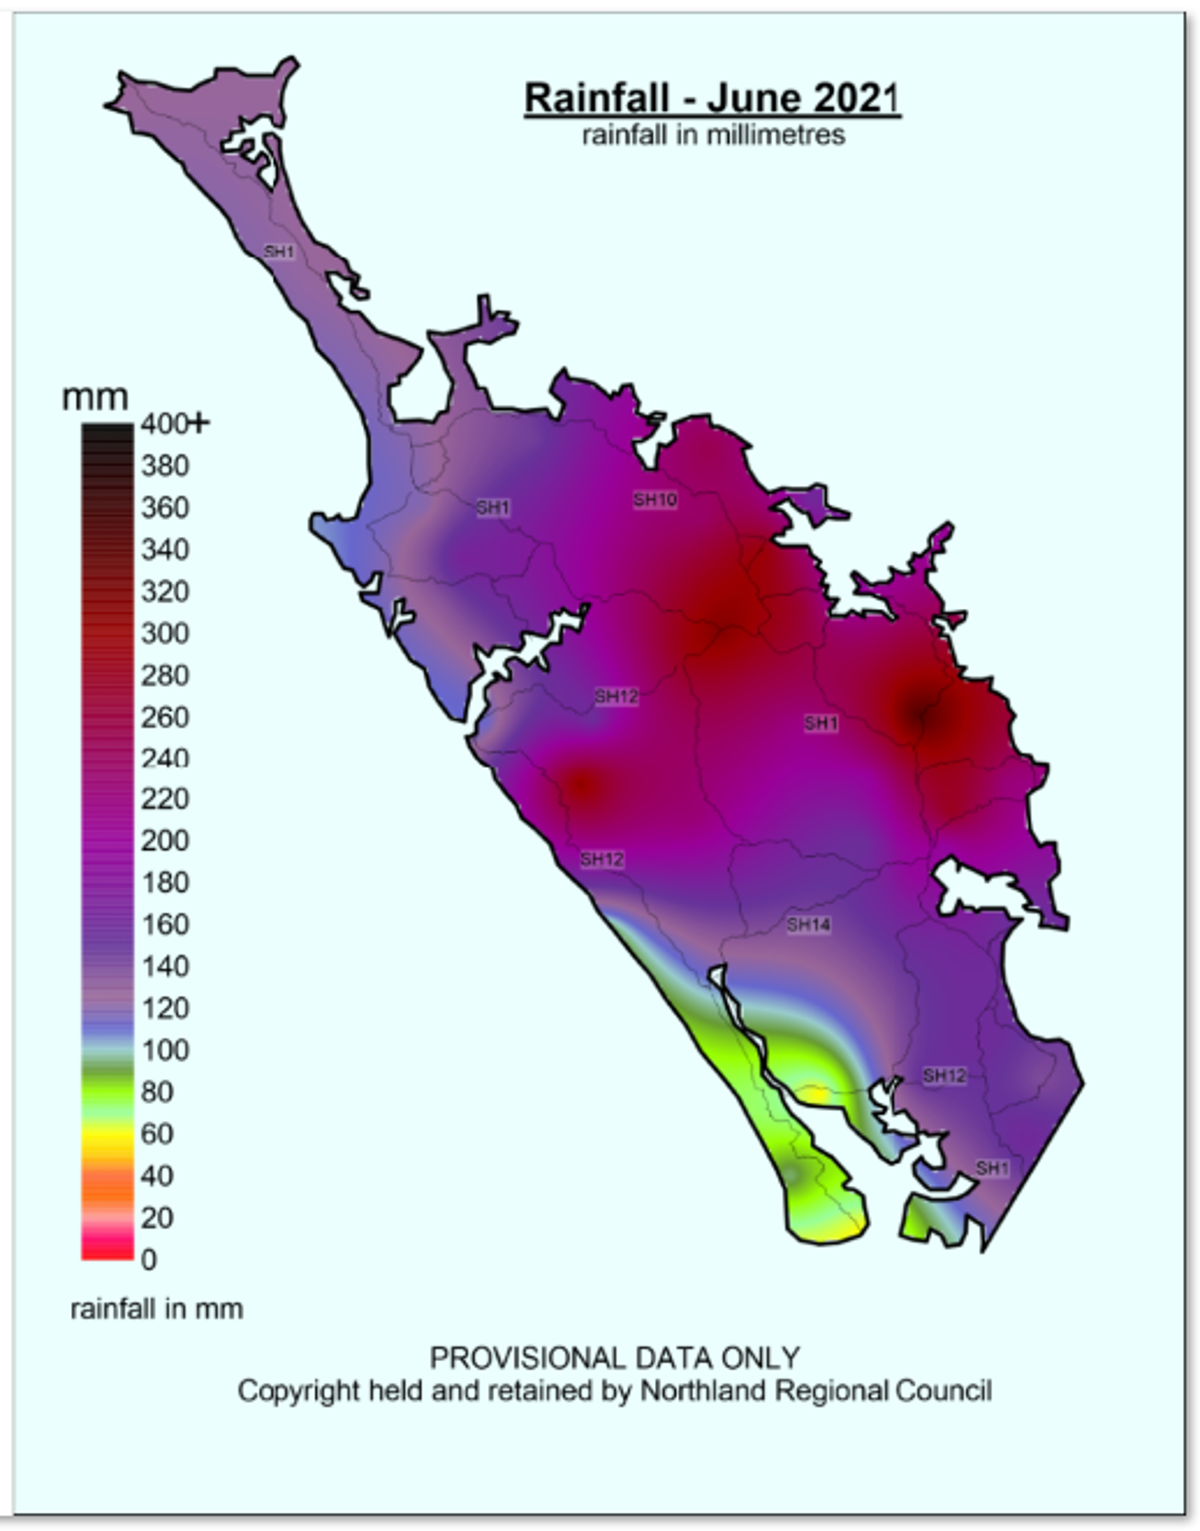
 June 2021 Rainfall In Millimetres
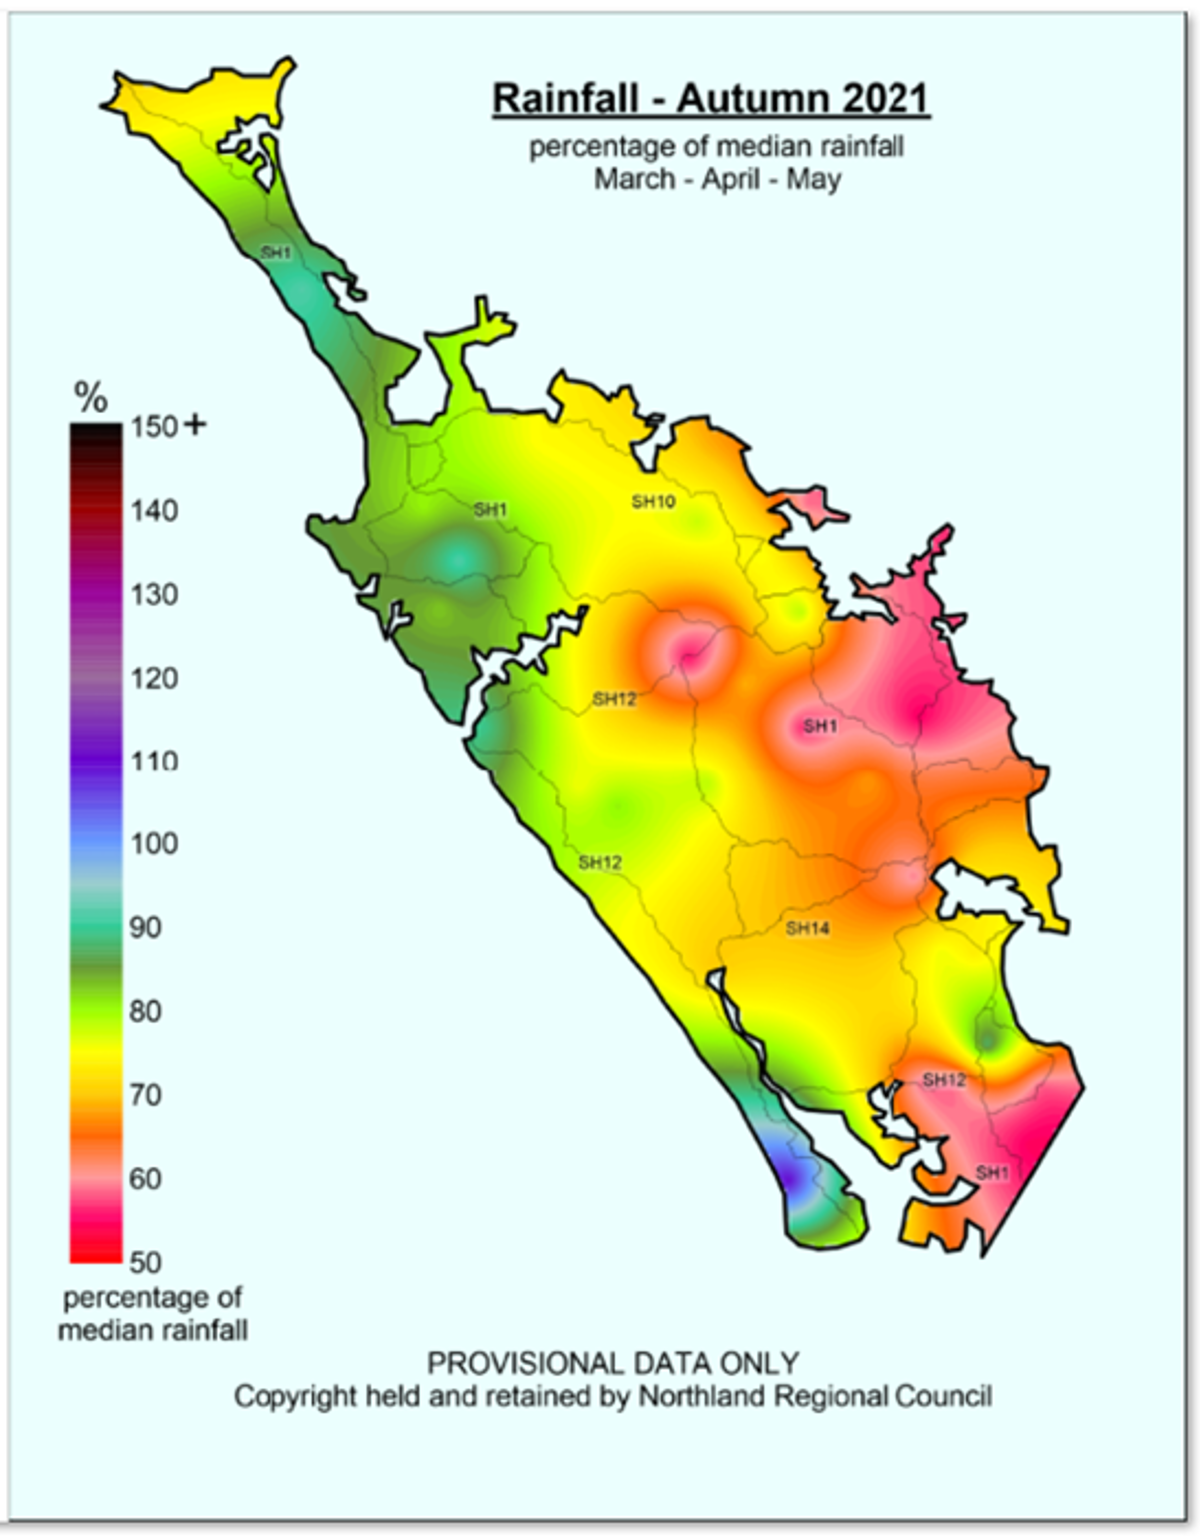
 Rainfall Autumn 2021 Percentage Of Median Rainfall March April May
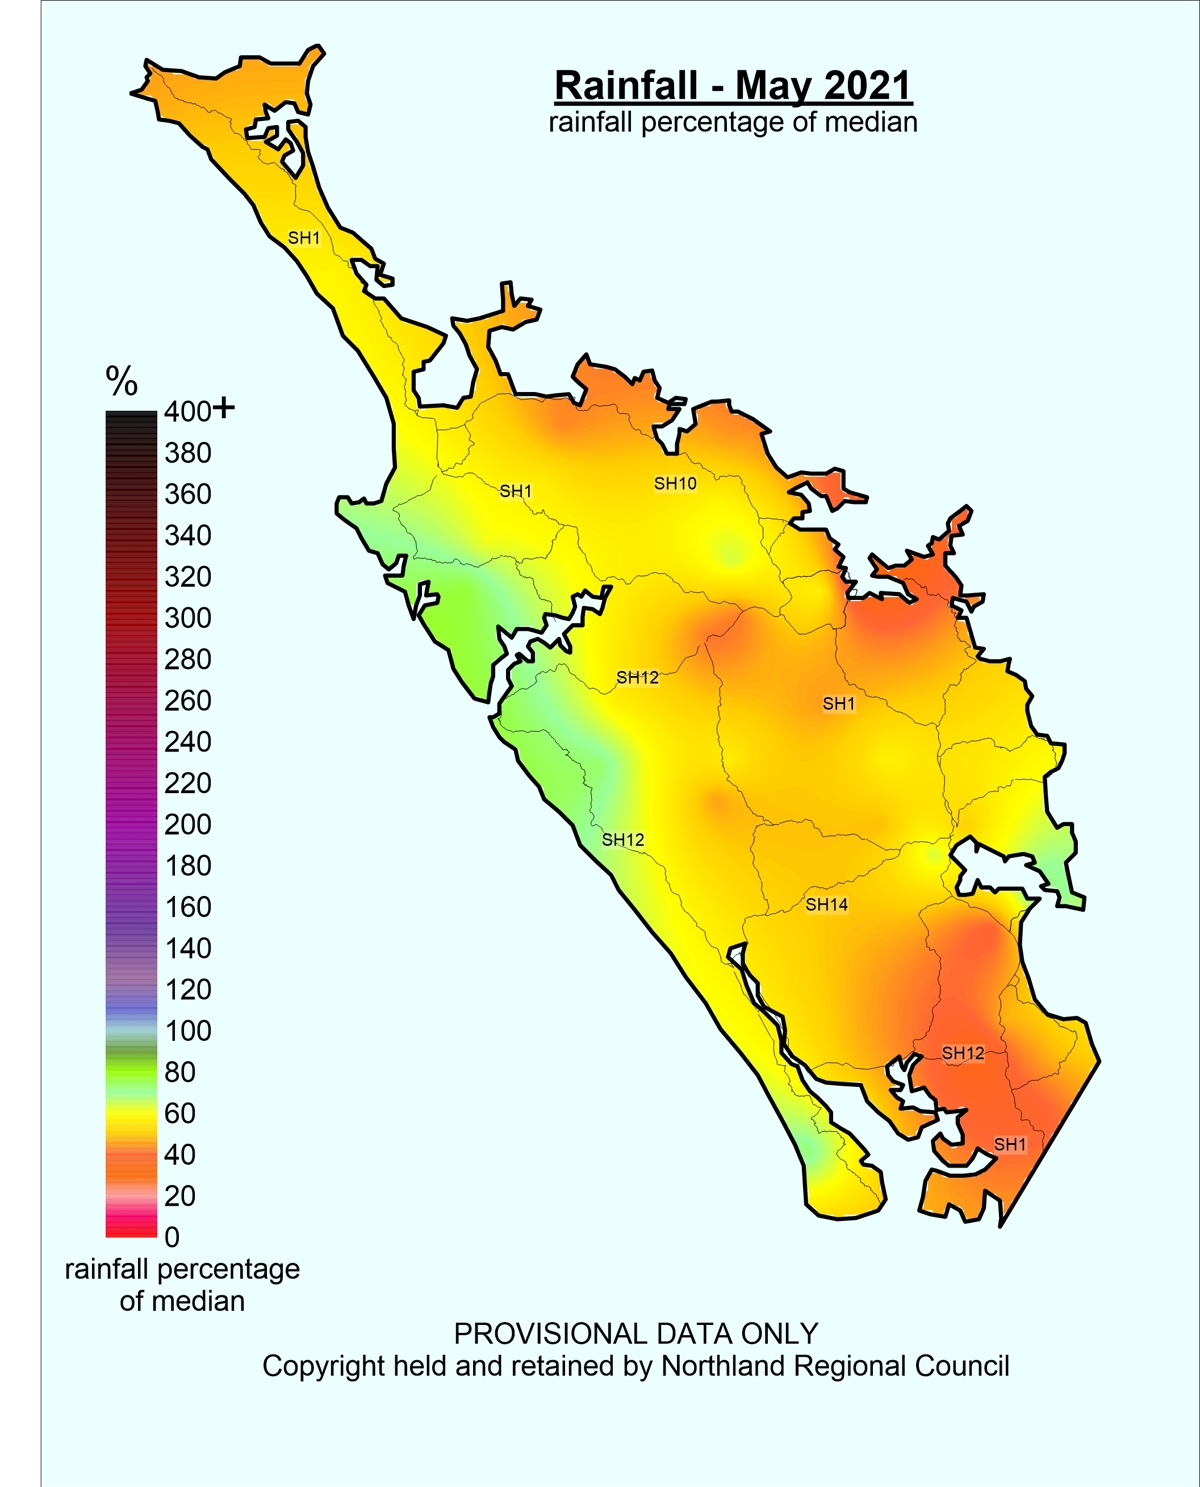
 May 2021 Rainfall Median Percentages
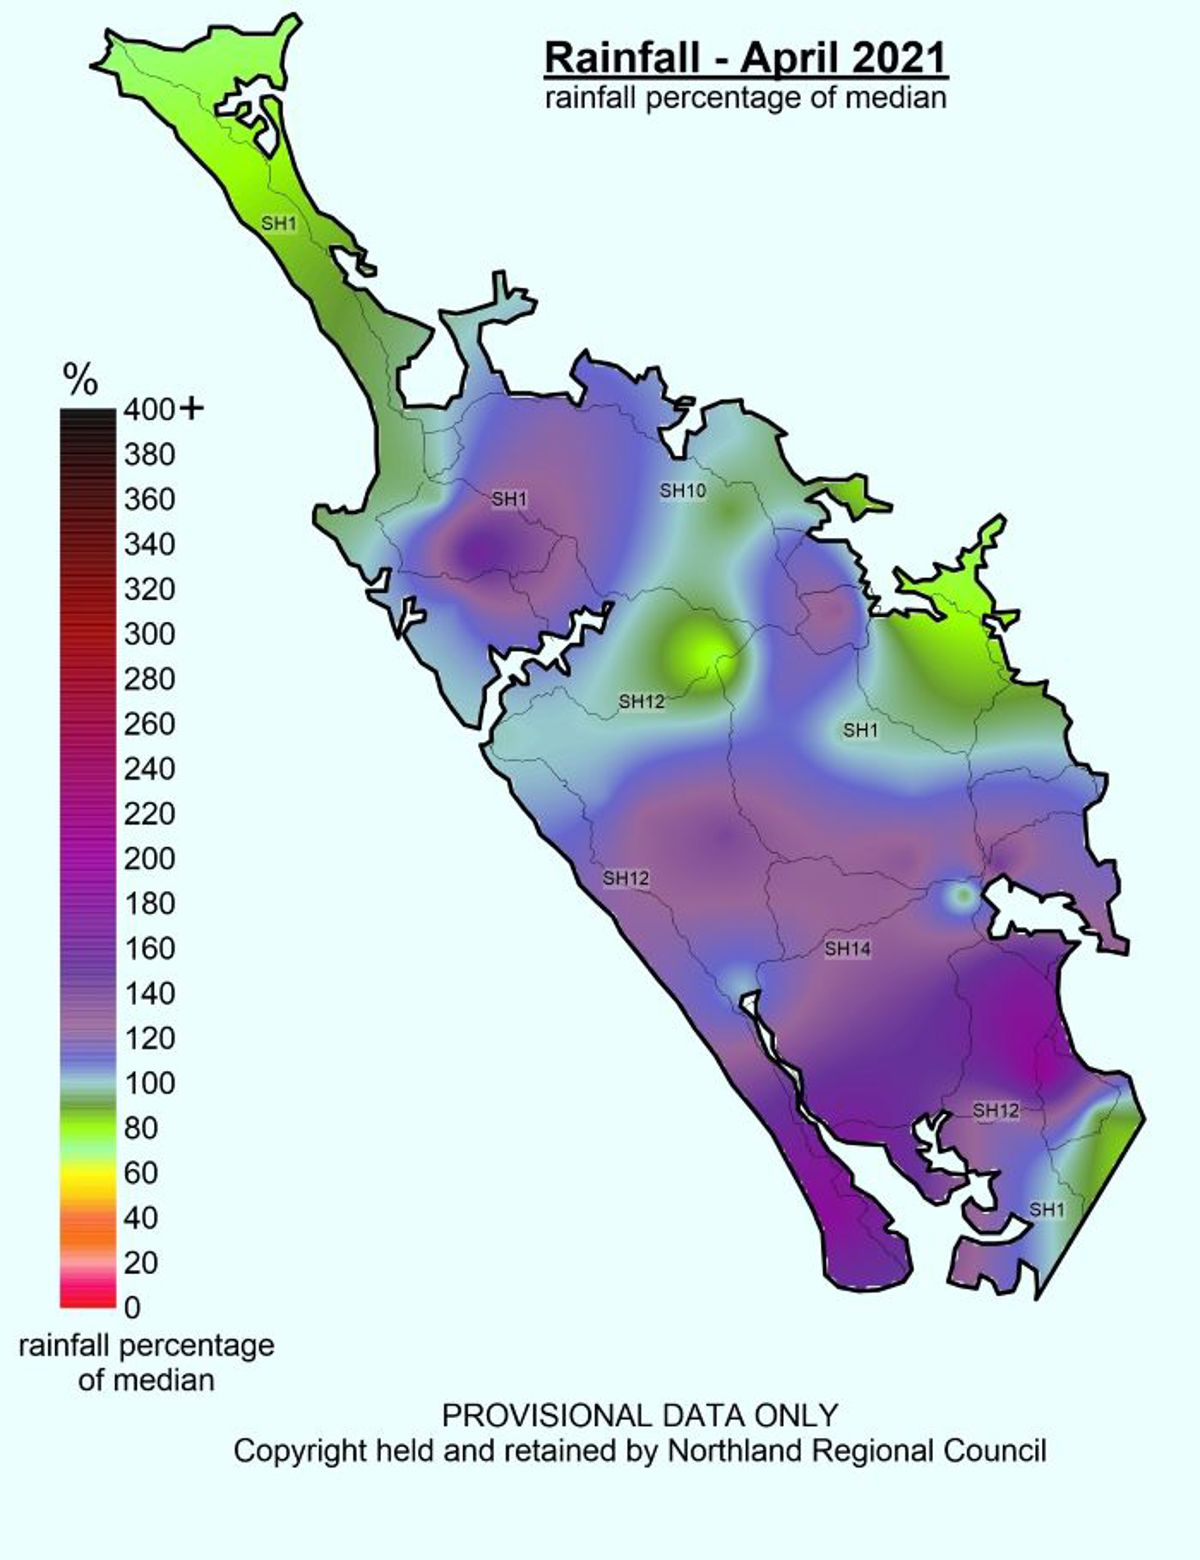
 April 2021 Rainfall Median Percentage
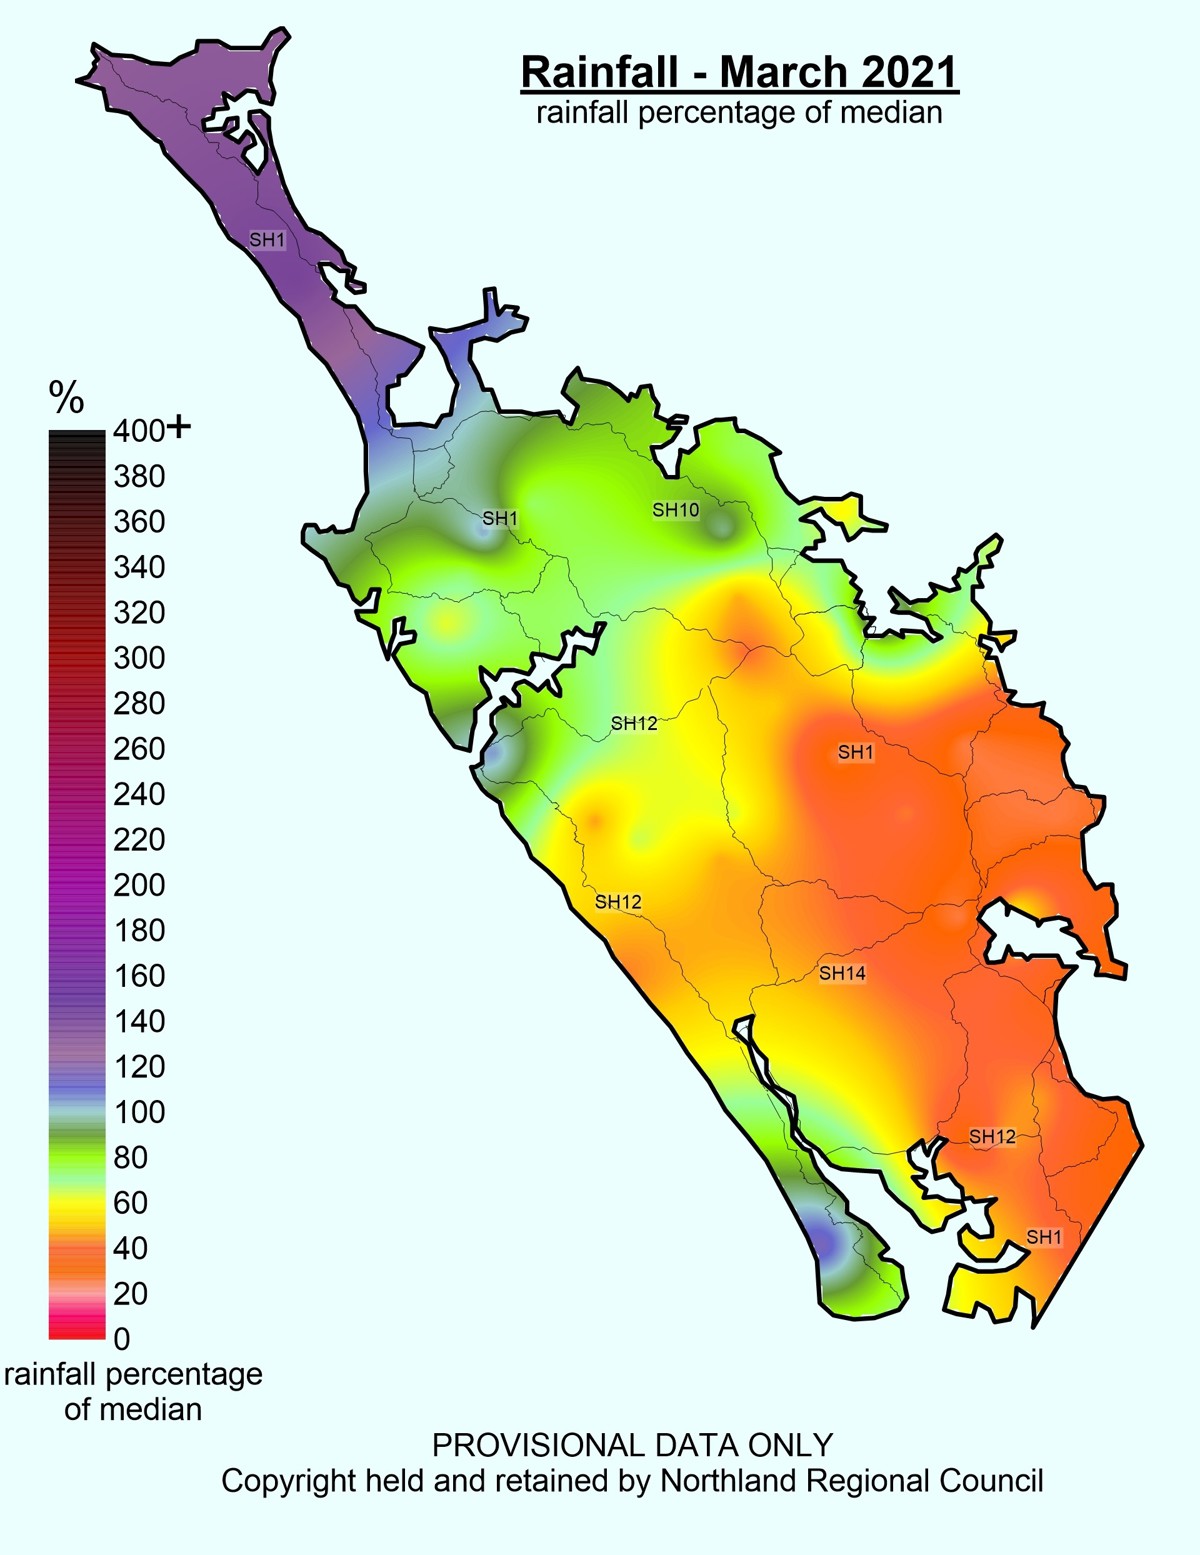
 March 2021 Median Rainfall Percentage
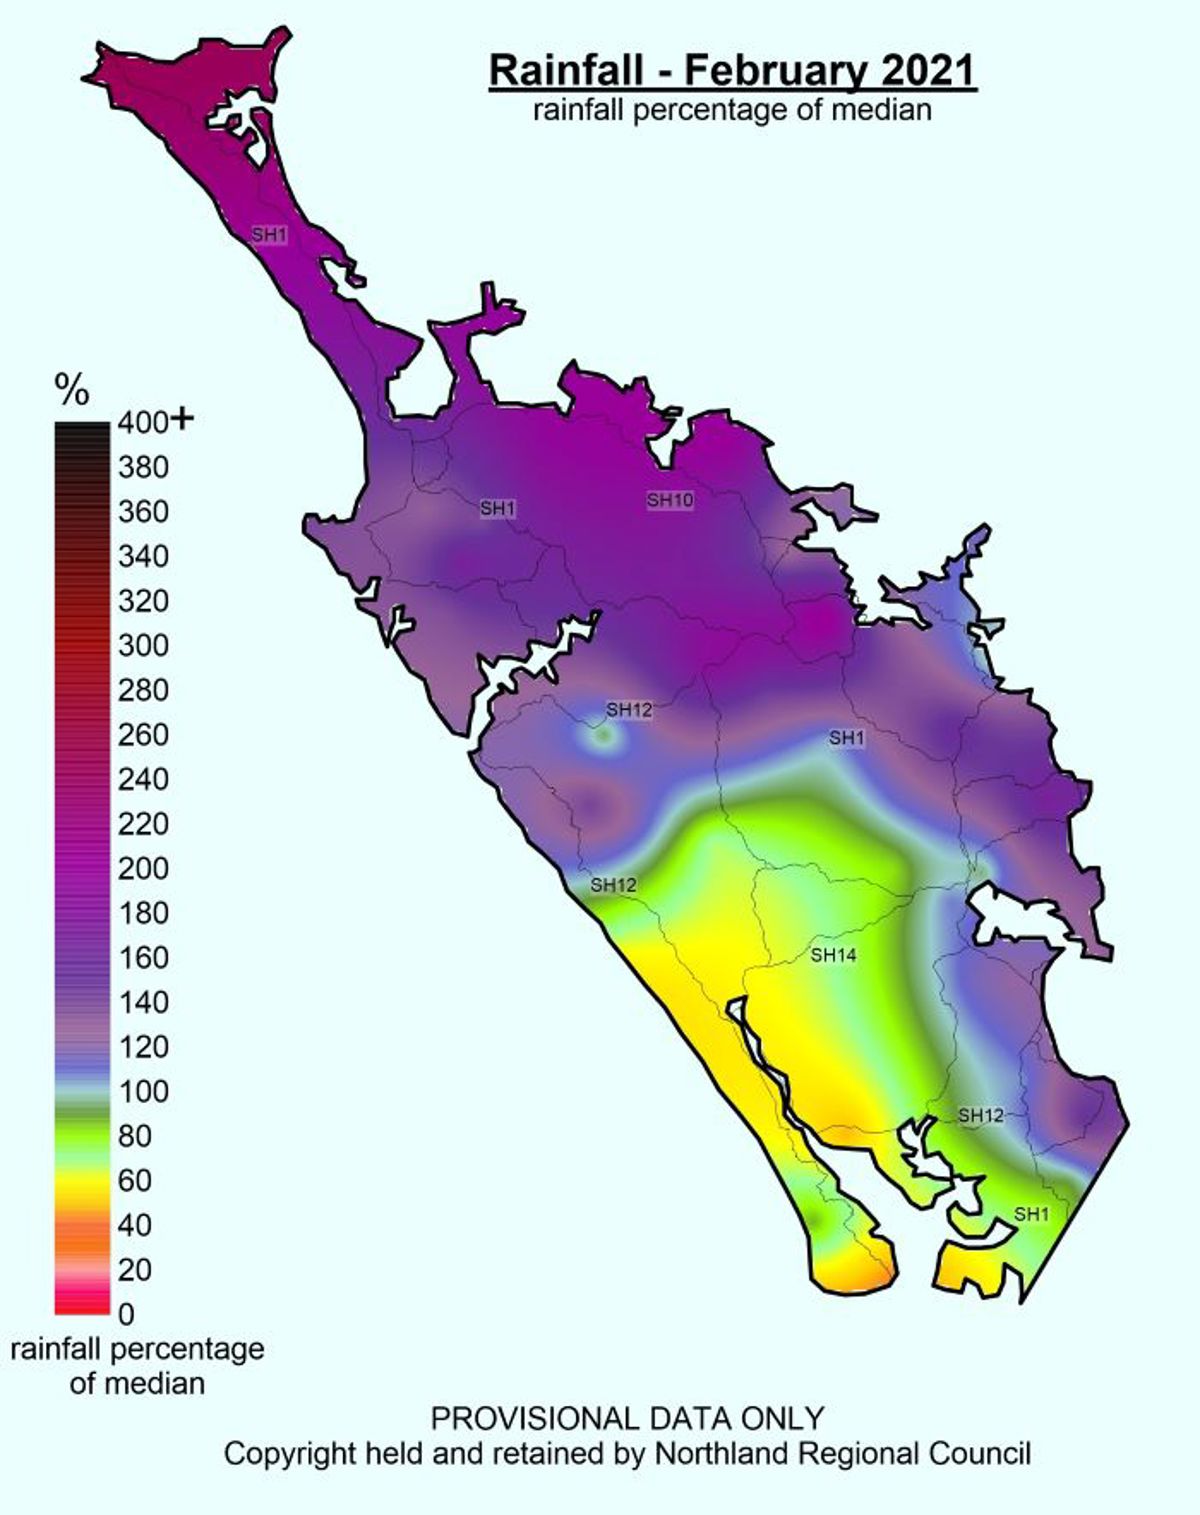
 February 2021 Median Percentage
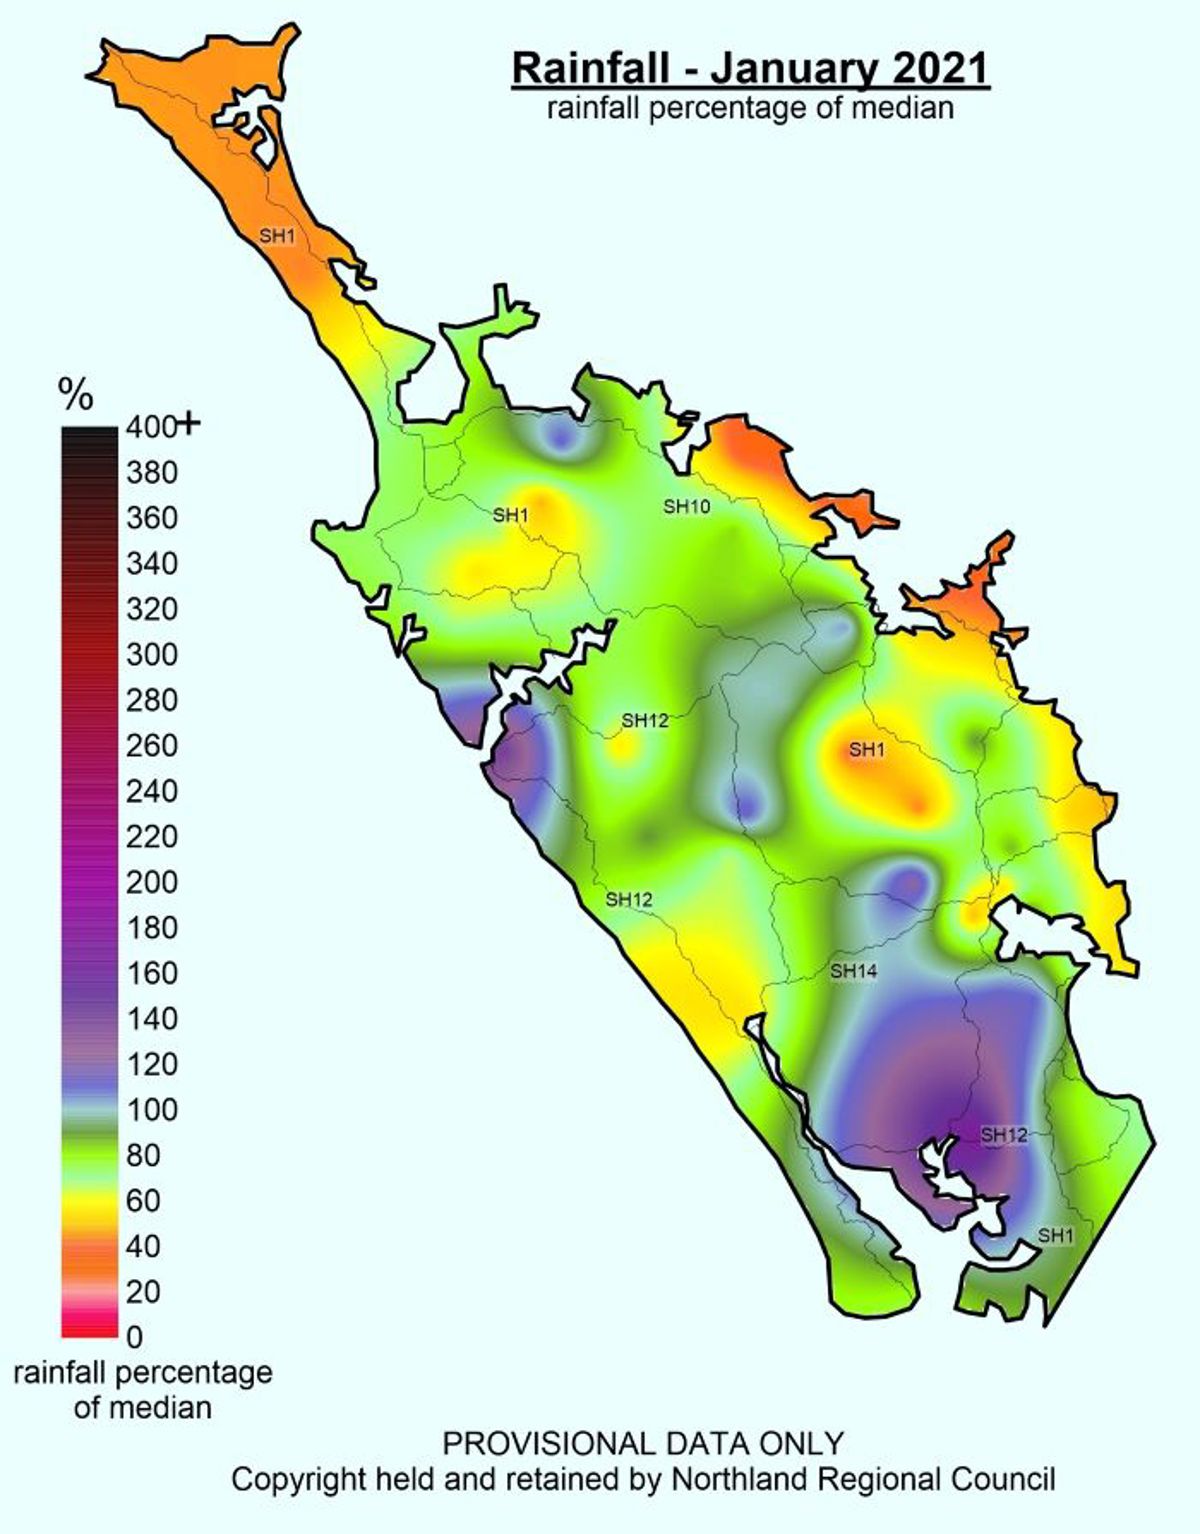
 January 2021 Median Percentages